YoForex AI educational guides
VWAP indicator: volume-weighted average price on forex charts
VWAP, or volume-weighted average price, is the average price over a period, with each price weighted by the volume traded at it. On forex charts the volume is usually tick volume, and the level depends on the session start and the timeframe you choose. It is a reference line for intraday price, not a forecast or a signal.
Published · Updated · By YoForex AI Editorial Team
VWAP is the volume-weighted average price over a chosen window. Each price in the window counts in proportion to the volume traded at it, so prices where more volume changed hands pull the average further. Traders plot it as one line, usually anchored to a fixed start such as the daily session open. On forex charts the volume behind that line is usually tick volume, and that changes how far the level can be trusted.
What is VWAP in trading?
The VWAP indicator draws that calculation on your chart. It starts at the first bar of its window, updates with each new bar, and resets when the next window begins. Because the window sets the result, two traders looking at the same pair can see different VWAP levels, and both can be arithmetically correct.
The idea behind it is simple. A price that many trades passed through represents the window better than a price visited only briefly. The level is therefore a reference for where the average traded price sits. It is not a measure of fair value, and it is not a price target.
How is VWAP calculated?
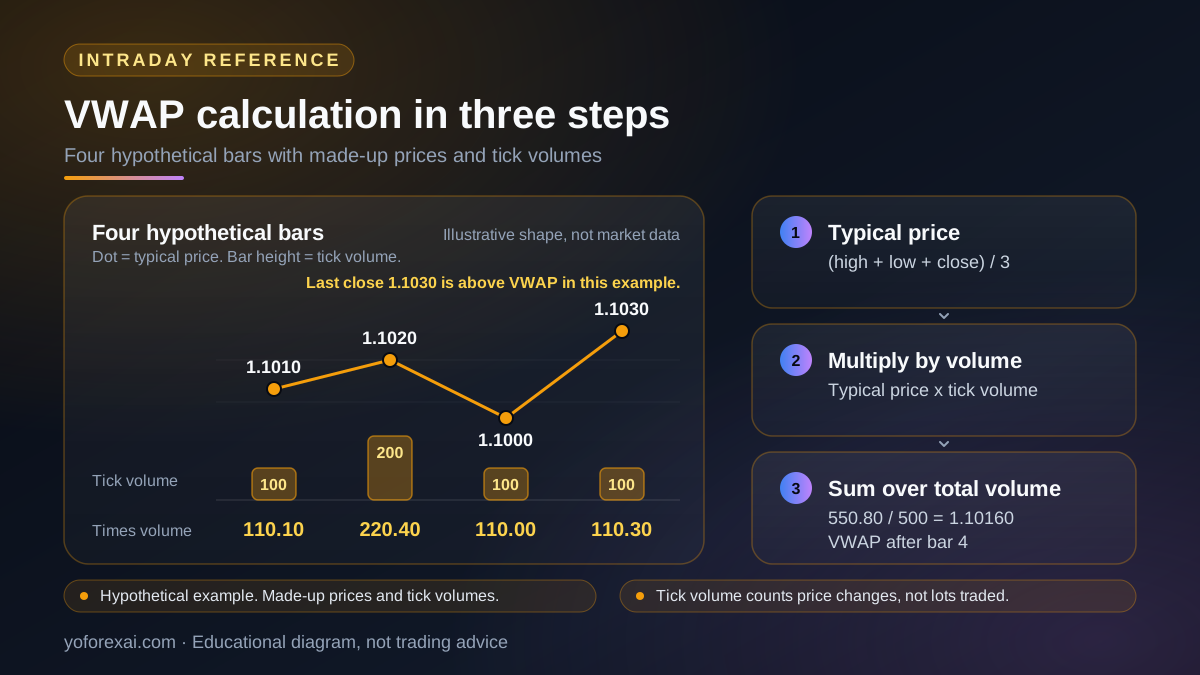
For each bar, take the typical price, which is the high plus the low plus the close, divided by three. Multiply that typical price by the bar’s volume. Add those products across every bar in the window, then divide the total by the sum of the volumes. The result is one number, and it always sits inside the range of prices in the window.
The table below is a hypothetical example with made-up prices and tick volumes for four bars. It shows the arithmetic only. It is not a market record.
| Bar | Typical price | Tick volume | Typical price times volume |
|---|---|---|---|
| 1 | 1.1010 | 100 | 110.10 |
| 2 | 1.1020 | 200 | 220.40 |
| 3 | 1.1000 | 100 | 110.00 |
| 4 | 1.1030 | 100 | 110.30 |
| Total | not summed | 500 | 550.80 |
Bar 1, for example, has a high of 1.1020, a low of 1.1000 and a close of 1.1010, so its typical price is 1.1010. Dividing the total of 550.80 by the total volume of 500 gives a VWAP of 1.10160 after bar 4. In this example the last close of 1.1030 sits above that level.
Why is volume a problem for VWAP on forex charts?
VWAP needs a volume figure for every bar, and spot forex has no single central exchange where all trades are reported. On MetaTrader 5, the MetaQuotes Volumes help page says that for the Forex market, volume means the number of ticks, or price changes, in each time interval. That is a count of price updates. It is not the number of lots traded.
The MQL5 documentation for the MqlRates structure lists tick_volume and real_volume as separate fields. Its code comments label them “Tick volume” and “Trade volume”, so the tick count on your chart and a broker’s traded volume are different numbers. The OBV guide shows the same caveat for a volume-based indicator.
The CFTC Glossary defines volume as “The number of contracts traded during a specified period of time.” That definition suits exchange-traded futures, where a count of contracts exists. It does not describe the tick counts most forex charts show.
The practical result is that a forex VWAP is closer to a tick-weighted average of price. It can still show where price spent time in the window, which is useful for reading a session. It is not the same measure a stock or futures trader would see. Say which volume you used whenever you report a level.
How do the session start and timeframe change the level?
Two settings decide most of the difference between VWAP levels on the same chart: where the window starts and how large each bar is. Write both down whenever you record a level. The table shows what each setting does.
| Setting | Where it resets | What the level reflects | Main caveat |
|---|---|---|---|
| Daily window from broker server midnight | Once a day, at the server time | Price since the server day began | Server time depends on the broker, so levels from two brokers are not directly comparable. |
| London session open | The start of the session you set | Price since the London open | The start time is your choice, and it must be converted from your local time to the server time. |
| New York session open | The start of the session you set | Price since the New York open | Same start-time caveat. The level resets in the middle of any trend that began earlier. |
| Rolling window of the last N bars | Never. Old bars drop out. | The last N bars only | It is not anchored to a session, and the length N is an arbitrary choice. |
| Small bars, such as one-minute | Depends on the window you chose | Many bars, each with few ticks | Each bar holds few price changes, so the level reacts to short-term noise. |
| Large bars, such as hourly | Depends on the window you chose | Fewer bars, each with more ticks | The level moves slowly and can lag the move you are trying to read. |
Keep the same window and bar size for every chart you compare. A level from a different session start is a different indicator, even when it carries the same name.
How do traders read VWAP on a chart?
Traders use VWAP as a reference for where price sits relative to the average traded price in the window. The four readings below are common. Each one is a method to test, not a rule to trade.
- Price above the line. Some traders read this as buyers holding control within the window. Check that reading against the higher-timeframe trend before you accept it.
- Price below the line. The reverse reading applies. Some traders look for a pullback to the level inside a trend, but price can move through it and keep going.
- Distance from the line. A large gap between price and VWAP can be a reason to wait instead of acting. Define the distance in pips before you test it, because “large” means nothing until it is measured.
- Repeated touches. A level that price returns to several times in one session may deserve attention. That is an observation to record, not a proven effect.
The session open is also the anchor for an opening range breakout, which is a separate method with its own rules. The ORB strategy guide covers those rules. Any VWAP-based rule you write should be tested with the steps in the expert advisor evaluation guide, and the first test should use a demo or a paper trading record.
Risk warning. You can lose more than you deposit, depending on your broker and country. Forex trades are often made on margin, and a VWAP reading does not reduce the size of a loss. The leverage and margin guide explains how margin requirements work. Before you trade any setup, check the rules that apply to you with your own regulator or local authority.
Is VWAP built into MetaTrader 5?
Not as one of the volume indicators in the MetaQuotes volume indicator help section. That section lists four: Volumes, Accumulation/Distribution, Money Flow Index and On Balance Volume. None of them is VWAP. Check your own terminal’s Indicators menu before you assume the answer, because a help index is a snapshot and custom indicators are common.
A third-party VWAP file is a custom indicator. Before you rely on one, check its settings, its source if you can see it, and which volume feed it reads. A line that looks right on one broker can be drawn from different tick counts on another.
YoForex AI is our product. It reads a chart you provide and returns a suggested direction, entry, stop-loss and take-profit levels with the model’s reasoning, for you to review. If a VWAP level appears in that reasoning, check its session start and bar size against your own chart before you use it.
What VWAP cannot tell you
VWAP describes past prices and volume inside a window you chose. It does not tell you:
- where price will go next, or whether the level will hold;
- which orders sit above or below the line, since spot forex has no central tape of trades to read;
- what volume other brokers recorded, because each broker’s tick count comes from its own feed;
- whether a break above or below the line will continue.
A VWAP line is useful for describing a session after it has happened. It cannot turn a weak setup into a strong one, and a line drawn after the fact always looks clean. For a broader check on how an indicator fits a chart, the AI forex chart analysis guide lists the checks to run before you trust any level.
Key takeaways
- VWAP is the average price over a window, with each price weighted by the volume traded at it.
- On forex charts the volume is usually tick volume, which counts price changes in each interval rather than lots traded.
- The level depends on the session start and the bar size, so record both whenever you use it.
- The MetaQuotes volume indicator section does not list a VWAP indicator, so check your terminal and any custom file before you rely on one.
- VWAP describes past price. Test any rule built on it on a demo or paper record before you risk money.
Frequently asked questions
Is VWAP the same as a moving average?
No. A simple or exponential moving average weights bars by count or by recency, not by volume. VWAP weights each price by the volume at that price, and a session VWAP resets at its start point. The EMA vs SMA guide covers the moving-average formulas.
Does forex have real volume for VWAP?
Not in the way futures or stock markets do. Spot forex has no single central exchange, so most MetaTrader charts show tick volume, which counts price changes in each interval. Some feeds report trade volume, but it comes from one broker and is not a market-wide total.
Which start time should a VWAP use?
There is no single correct start. A daily session open is common for intraday reading. Pick one, state it, and keep it for every chart you compare. Broker server time is not the same as your local time, so convert it before you set a session start.
Can VWAP tell me when to enter a trade?
No line can do that on its own. VWAP can be one input to a written rule that also sets an entry trigger, a stop and an exit. Test that rule forward before you use it, and accept poor results when they come.
Is VWAP built into MT5?
Not in the MetaQuotes volume indicator section checked for this page. Look in your terminal’s Indicators menu, and treat any third-party VWAP file as unverified until you know which volume feed it reads and how it resets.
Sources and verification
Primary-source links used for the platform behavior and risk statements in this guide. Sources reviewed 9 November 2026.
- U.S. Commodity Futures Trading Commission: Futures Glossary · Reviewed
- MetaQuotes: Volume Indicators · Reviewed
- MetaQuotes: Volumes · Reviewed
- MetaQuotes: MqlRates · Reviewed