YoForex AI educational guides
OBV indicator explained: on-balance volume rules and the forex tick-volume caveat
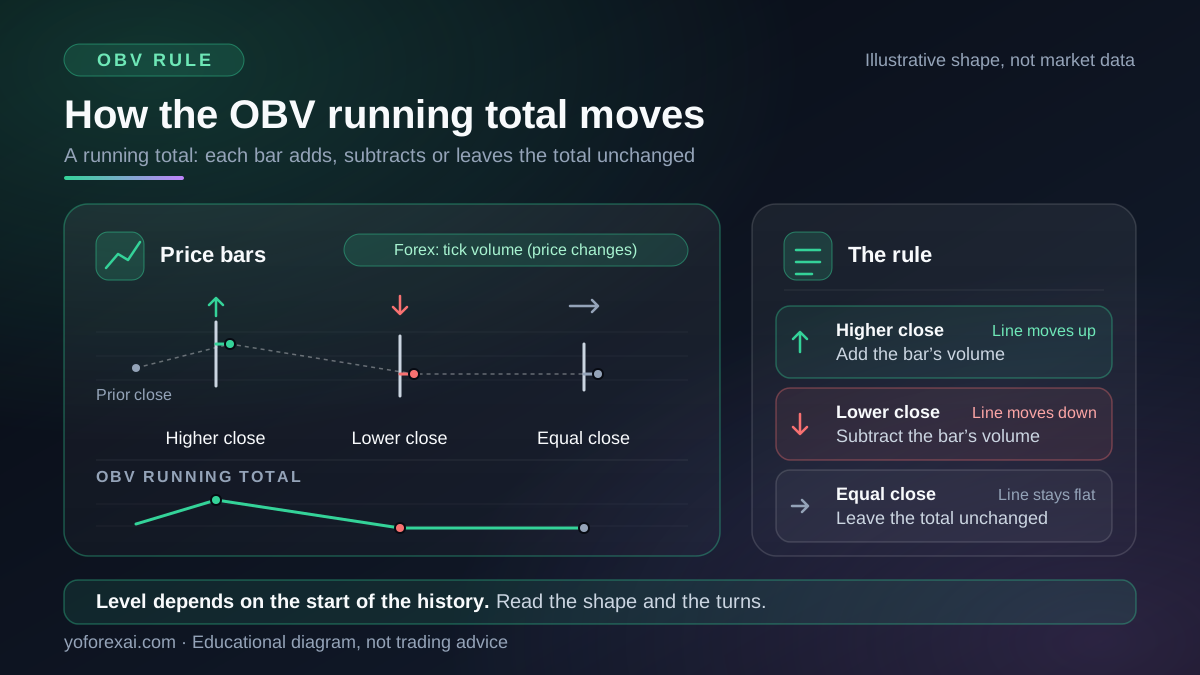
On-balance volume (OBV) is a running total of volume. It adds the bar's volume when the close is higher than the previous close and subtracts it when the close is lower. Traders compare the OBV line with price to look for divergence. On MetaTrader 5 forex charts, the volume is usually tick volume, so OBV is a proxy.
Published · Updated · By YoForex AI Editorial Team
What is on-balance volume (OBV)?
On-balance volume, usually shortened to OBV, is a cumulative indicator. It tries to show whether volume seems to be flowing in or out as price moves. OBV does not measure price itself. It starts from a running total, adds or subtracts each bar's volume, and plots the result as a line in a separate window below the price chart.
That makes OBV a different kind of tool from a moving average. A moving average summarizes price. OBV summarizes volume, and it uses the direction of each bar's close to decide whether that volume counts as added or removed. The line is most useful when you look at its shape and its turns, not at the number on the scale.
How is OBV calculated?
The MetaQuotes help page for On Balance Volume gives the rule in its calculation section. When the current close is higher than the previous close, the bar's volume is added to the previous OBV value. When the current close is lower, the bar's volume is subtracted. The rising-close case is written as OBV(i) = OBV(i - 1) + VOLUME(i), where VOLUME(i) is the volume of the current bar.
| Close compared with previous close | Action on the running total | Effect on the OBV line | Plain-language note |
|---|---|---|---|
| Higher | Add the bar's volume | The line moves up | Volume is counted as flowing in. |
| Lower | Subtract the bar's volume | The line moves down | Volume is counted as flowing out. |
| Equal | Leave the total unchanged | The line stays flat | The bar adds nothing, even if its volume was large. |
The MetaQuotes page does not state a starting value. That matters because the level of the line depends on where the chart's history begins. Two charts of the same pair can show the same shape at different heights. Compare the slope, the turns and the timing against price, not the absolute value.
How do traders read OBV divergence?
A common way to read OBV is divergence, which means the OBV line and the price move do not agree. A bullish divergence appears when price makes a lower low while OBV makes a higher low. A bearish divergence appears when price makes a higher high while OBV makes a lower high. The idea is that the volume behind the price move may be weakening, even though price has not yet turned. This way of reading the line comes from general technical-analysis practice. The MetaQuotes page does not use the word divergence. It describes a “non-confirmation” when price movement precedes OBV movement.
A divergence is an observation, not a signal. Price can keep moving against it for a long time, and an OBV line can keep diverging through a strong trend. When you check one, follow the same steps each time:
- Mark the swing points on the price chart first, and note the timeframe.
- Mark the matching points on the OBV line, not on the price scale.
- Wait for price to confirm the turn, for example with a close beyond a level you marked as a zone. The support and resistance guide explains how to mark those zones.
Use the same timeframe for the swings and for the OBV line. A divergence on a fifteen-minute chart can disappear on a daily chart, and the reverse can also happen.
Does tick volume work for OBV on forex charts?
This is the caveat that matters most for MetaTrader 5 users. OBV uses the volume value on each bar, which the chart supplies. On a forex symbol, the MetaQuotes help page for Volumes says the indicator counts the number of price changes within each period of the timeframe. It does not count traded contracts. The same page says that for stock symbols the indicator reflects actual traded volume.
Spot forex trades over the counter, so no single exchange publishes one volume tape. Brokers source prices from their own liquidity providers, and each price feed can differ. A tick count from one broker can therefore differ from another broker's count for the same pair and hour.
The practical result is that OBV on forex is a proxy for activity and the frequency of price updates. It is not proof of how many lots were bought or sold. A sharp OBV move during a quiet session can come from a burst of quote changes around a news release, not from a large volume of trades. Read a forex OBV line as a rough activity measure, and keep the caveat in your notes.
How do you add OBV on MetaTrader 5?
Setting up OBV takes a few minutes. The steps below are the same process you would use on any chart, so you can repeat them for each test.
- Open the chart for the symbol and timeframe you want to study.
- Open the indicator list and choose On Balance Volume from the volume indicators.
- Open the indicator properties and note any inputs the terminal shows. The MetaQuotes On Balance Volume help page lists none.
- Note the symbol, timeframe and any inputs in your test record. OBV lines from different timeframes are not comparable on the same scale.
- Keep the chart settings fixed while you test a rule. Changing a setting halfway through changes the test.
How does OBV fit with other checks?
OBV works best as one input among several. It describes volume flow. It does not show where price is, or whether a level will hold. The table below lists the checks that most often sit beside it, and the limit each one carries on spot forex.
| Check | What it adds | Limit on spot forex |
|---|---|---|
| Chart patterns | Shape and boundaries of the price move, read in the chart patterns guide | Boundaries are drawn by hand and can be placed differently by two readers. |
| Support and resistance | Zones where price has reacted before | Zones are a judgment call. The same chart can show different zones to different readers. |
| Volume spread analysis | Volume read against the bar range and close, in the volume spread analysis guide | It uses the same tick-volume series on forex charts. |
| VWAP | A volume-weighted average price, covered in the VWAP guide | On forex it depends on tick volume and on where the session starts. |
If you use an AI chart tool, ask it to name the volume series it read and the bars it used. Check those bars against your own chart before you rely on the answer. The AI forex chart analysis guide has a checklist for that step. The MACD guide covers a momentum indicator that is often read alongside volume, for a different view of the same move.
What OBV cannot tell you
OBV is simple, and its simplicity sets its limits. Read the list below before you put a rule on the chart.
- It gives no price target. The line has no fixed scale, so it cannot say how far price will travel.
- It gives no probability. A divergence that worked on past bars can fail on the next one. No published win rate applies to your broker, your symbol or your timeframe.
- It does not split a bar into buying and selling. Each bar is counted in one direction only, based on whether its close is higher or lower than the previous close.
- It cannot see exchange volume or the order book in spot forex. On forex charts, the volume value it reads is the price-change count that the Volumes page describes.
- It depends on the start of the history. Compare the shape and the turns, not the absolute value, across charts.
- A flat bar adds nothing. A close equal to the previous close leaves the total unchanged, even when the bar was busy.
An OBV rule can be tested in the MetaTrader 5 Strategy Tester, but the result describes only the data, settings and period you used. The evaluate a forex EA guide explains how to check a backtest before you trust it.
Risk warning. Volume indicators do not remove risk. Forex is traded with leverage, which can magnify losses quickly. You can lose more than you deposit, depending on your broker and country. A divergence that looks clear in hindsight may give no warning in real time. Check the rules that apply to you with your own regulator or local authority before you trade any setup.
Key takeaways
- OBV is a running total. It adds volume when the close is higher than the previous close and subtracts it when the close is lower.
- Read the shape and the turns of the OBV line, not its absolute level, because the MetaQuotes description gives no starting value.
- On forex symbols, the MetaQuotes Volumes page says volume counts price changes rather than traded contracts. OBV on forex is therefore a proxy.
- A divergence between OBV and price is an observation. Wait for price to confirm, and record the symbol and timeframe each time.
- OBV gives no target, no probability and no split between buying and selling. Test any rule forward before you risk money.
Frequently asked questions
What does OBV show that price does not?
OBV shows the direction of volume flow over the bars you have on the chart. Price shows where the market traded. When the two disagree, that disagreement is the observation OBV is used for. OBV does not show how large the trades were on a forex chart.
Is a rising OBV line a buy signal?
No. A rising OBV line means the signed volume added so far is positive. A few large up-closes can lift it even when most closes were lower. It is not an instruction to buy. Pair it with a price level or a rule you wrote in advance, and test that combination.
Why does OBV behave differently on forex than on stocks?
The MetaQuotes Volumes page says that for stock symbols the indicator reflects actual traded volume. For forex symbols, it says the count is of price changes. Spot forex trades over the counter, so no single exchange publishes one volume tape. The same OBV formula therefore measures a different thing on each market.
Which OBV settings should I use?
The OBV rule has no length to tune in the way a moving average does. The MetaQuotes On Balance Volume page lists no inputs. Keep the symbol, timeframe and chart settings fixed while you test, and note them in your record.
Can an expert advisor use OBV?
An expert advisor can read indicator values, so an OBV rule can be coded. The result is only as good as the rule and the test behind it. Check how the EA defines the volume it reads before you rely on its inputs, and test it on a demo account first.
Sources and verification
Primary-source links used for the platform behavior and risk statements in this guide. Sources reviewed 9 November 2026.
- MetaQuotes: On Balance Volume · Reviewed
- MetaQuotes: Volumes · Reviewed