YoForex AI educational guides
Trading chart patterns: 15 forex patterns, their type, and failure signals
Trading chart patterns are shapes that form on price charts and are often read as signs of a reversal or a continuation. This guide lists 15 common forex patterns, sorts them by type, and gives the confirmation and failure signal for each. A pattern is confirmed only after price crosses its breakout level, and it can still fail.
Published · Updated · By YoForex AI Editorial Team
What are trading chart patterns?
Trading chart patterns are shapes in price history that traders use to describe how buyers and sellers appear to be behaving. Common examples include double tops, flags, and triangles. The same shapes appear on any forex pair, index, or metal chart, because the chart shows price movement rather than the name of the instrument. A pattern is a way to organize what you see. It is not a forecast, and it does not tell you how much price will move.
The CFTC Futures Glossary describes charting as the use of graphs and charts in the technical analysis of futures markets. Its entry for head and shoulders calls the formation one that is generally considered predictive of a price reversal. That is a description of how many practitioners read the shape. It is not evidence that the pattern works on a given market or timeframe.
The UK Financial Conduct Authority makes a related point in its guidance on price graphs for stocks and investments. Online charts can show a selected timeframe that favors one view, and they cannot reliably predict future results. Read any chart with that limit in mind.
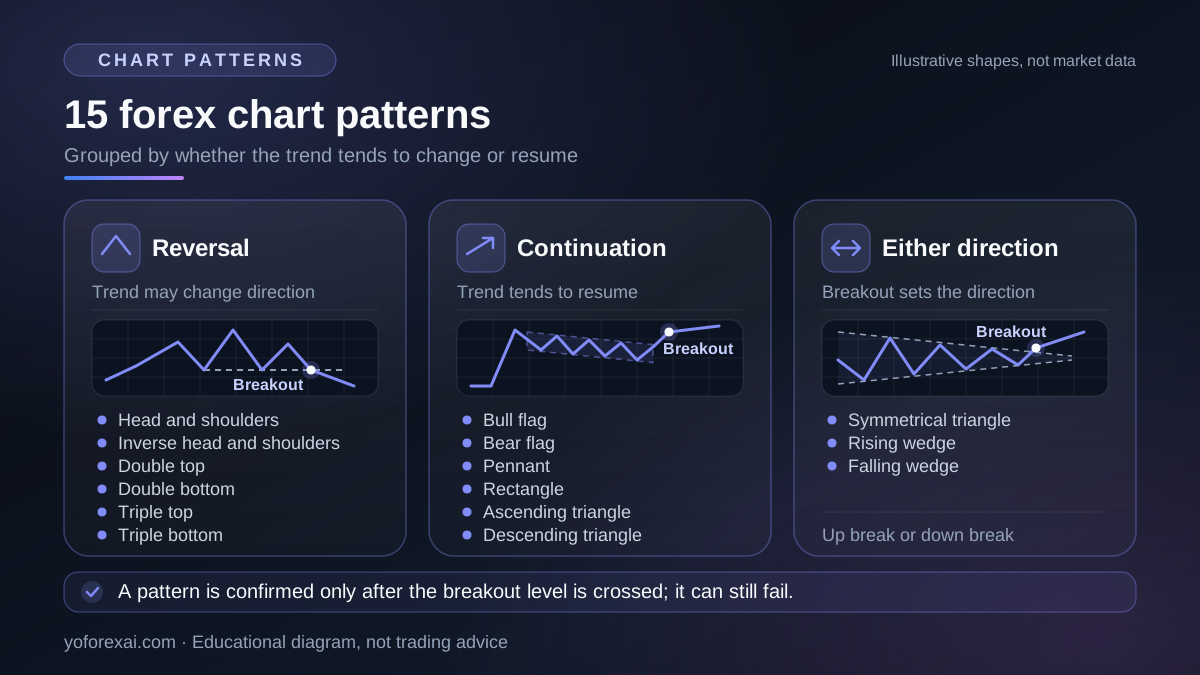
How do reversal and continuation patterns differ?
A reversal pattern suggests that the previous move may be losing strength and that price could travel in the opposite direction. A continuation pattern suggests a pause inside an existing move, after which price may resume in the same direction. The distinction matters because the same visual shape can carry a different meaning depending on where it forms. A double top at the end of a long rally is a reversal candidate. A rectangle inside an established rally is a continuation candidate.
The third group, either direction, covers symmetrical triangles, rising wedges, and falling wedges. These shapes do not tell you which way price will break until it breaks. Rising wedges are usually treated as bearish and falling wedges as bullish, but that is a tendency, not a rule. Wedges can also appear as continuation patterns inside a trend, and as reversals at its end, so this guide keeps both in the either-direction group.
Trend context changes how much weight a pattern deserves. A bullish flag inside a strong daily downtrend has a different context from the same flag inside a daily uptrend. Check the higher timeframe before you check the small pattern.
The 15 patterns at a glance
Use this table as a checklist, not as a list of signals. The confirmation column gives the minimum condition commonly used to call a pattern complete. The invalidation column is the failure signal: the observation that tells you the pattern did not behave as expected. Neither column gives a probability of success.
| Pattern | Type | What confirms it | What invalidates it (failure signal) |
|---|---|---|---|
| Head and shoulders | Reversal | A close below the neckline after the right shoulder forms. | A close back above the neckline, or a right shoulder that exceeds the head. |
| Inverse head and shoulders | Reversal | A close above the neckline after the right shoulder forms. | A close back below the neckline, or a right shoulder that falls below the head. |
| Double top | Reversal | A close below the low between the two peaks. | A close back above the peaks after the breakdown. |
| Double bottom | Reversal | A close above the high between the two lows. | A close back below the lows after the breakout. |
| Triple top | Reversal | A close below the support line drawn through the lows between the three peaks. | A close back above that support line, or a fresh high above the three peaks. |
| Triple bottom | Reversal | A close above the resistance line drawn through the highs between the three lows. | A close back below that resistance line, or a fresh low below the three lows. |
| Bull flag | Continuation | A close above the upper boundary of the flag after a sharp rise. | A close back inside the flag, or below its lower boundary. |
| Bear flag | Continuation | A close below the lower boundary of the flag after a sharp fall. | A close back inside the flag, or above its upper boundary. |
| Pennant | Continuation | A close beyond the converging trendline in the direction of the prior move. | A close back between the converging lines after the break. |
| Rectangle | Continuation | A close beyond the range boundary in the direction of the prior trend. | A close back inside the range, which is a false breakout. |
| Ascending triangle | Continuation | A close above the flat resistance, with higher lows building into it. | A close back below the flat resistance after the breakout. |
| Descending triangle | Continuation | A close below the flat support, with lower highs building into it. | A close back above the flat support after the breakdown. |
| Symmetrical triangle | Either direction | A close beyond either boundary, with the break direction as the signal. | A close back inside the triangle after the break. |
| Rising wedge | Either direction | A close below the lower trendline of the wedge. | A close above the upper trendline of the wedge. |
| Falling wedge | Either direction | A close above the upper trendline of the wedge. | A close below the lower trendline of the wedge. |
How do you confirm a chart pattern?
Most confirmation rules depend on a close beyond a level, not a touch. A wick can pierce a neckline and then close back inside the pattern. If you act on the touch, you act on a condition that may not last. Choose one rule, such as the close of the candle on your chart timeframe, and apply it the same way every time.
- Draw the boundaries before you look for the break. Once a breakout has happened, almost any shape looks clean in hindsight.
- Wait for the close beyond the breakout level. Note the timeframe, the symbol, and the time of the close.
- Check one independent input, such as the higher-timeframe trend or a support and resistance level. The support and resistance guide explains how to mark those levels as zones.
- Define the invalidation point before entry, and check the distance to the next level. A pattern with a clear break but a distant target can still offer a poor reward for the risk taken.
Volume needs care in forex. Many MetaTrader charts show tick volume, which counts price updates rather than traded lots, and spot forex has no single central exchange volume. Treat tick volume as a rough activity measure, not as proof that large participants are involved.
Lines for these patterns are placed by hand. MetaQuotes describes trend lines, channels and horizontal levels as analytical objects that traders place manually, in contrast to indicators that calculate automatically. Its analytical objects help page lists these tools, and its chart help page notes that the platform offers 21 timeframes from one minute to one month. Record the timeframe used for each drawing, because a line drawn on a fifteen-minute chart can be meaningless on a daily chart.
Which false patterns cause the most mistakes?
Most losses from chart patterns come from process errors, not from the shape itself. The following failure modes appear often in reviews of pattern trades:
- Hindsight drawing. Lines fitted to past candles look cleaner than lines drawn while the market is moving.
- A close back inside the pattern. Many breakouts reverse within a few candles. Decide in advance how many candles you will wait before accepting a break.
- The wrong timeframe. A double top on a one-minute chart can be noise inside a daily range. State the timeframe with every observation.
- Ignoring the larger trend. A bullish flag inside a strong higher-timeframe decline needs a reason to be trusted.
- A stop placed by feel. A stop tied to the pattern edge can be far from the entry, and the loss can exceed the amount you planned to risk.
- Changing the rules after a result. If you move the boundary after a losing trade, the test no longer measures the pattern.
Pattern reading also has limits in automation. An AI model can label a shape you describe, but it can misplace a line or use the wrong scale. The AI forex chart analysis guide covers how to check model output against the chart before you rely on it.
How should you test a pattern before you use it?
A pattern that looked clear on past charts still needs a forward test. Write the rules first: the timeframe, the boundary method, the confirmation close, the invalidation point, and the position size. Then record each pattern as it appears, including the ones you did not trade. Compare the results with the rules, not with your memory of the best examples.
A demo account or a paper record can show whether you apply the rules consistently. It cannot show what real fills, spreads, and emotions would have done. The paper trading guide explains those limits. For a level-based version of the same test, read the supply and demand guide, which also explains why zone drawing is subjective.
Risk warning. Chart patterns do not remove risk. Forex trades can be made with leverage, which can magnify losses quickly and can lead to losses larger than an amount you planned to lose, depending on your account type and broker terms. A pattern that has worked for you on a few charts does not show that it will work next time. Before you trade any setup, check the rules that apply to you with your own regulator or local authority.
Key takeaways
- Trading chart patterns are shapes on a price chart. They organize observations; they do not forecast price.
- The 15 patterns fall into three groups: six reversal, six continuation, and three that can break either way.
- Confirm a pattern with a close beyond the breakout level, not a touch or a wick.
- Write down the invalidation point and the timeframe before you enter, and keep the rule fixed.
- Test the rules forward on a demo or paper record before you risk money, and accept the results when they are poor.
Frequently asked questions
What are the most reliable trading chart patterns?
No chart pattern is reliable on its own. Published claims of high reliability rarely state the market, the timeframe, the rules, or the sample size. Judge a pattern by a fixed set of rules and a record of how it performed on data you did not use to define those rules.
Are chart patterns the same in forex and stocks?
The shapes are the same, but the markets differ. Forex trades around the clock across many brokers, and spot forex has no single exchange tape. Stock charts often show exchange volume, while forex charts commonly show tick volume. Session opens and news releases can also create gaps that look like patterns.
How many chart patterns should a beginner learn?
Start with a small set. Two reversal patterns, such as the double top and the double bottom, and two continuation patterns, such as the bull flag and the rectangle, are enough to build a test. Add more only after your current rules are written and tested.
Can AI find chart patterns for me?
An AI model can describe a shape you show it, but its boundaries and levels need checking against the chart and the timeframe. Ask it to state the candles it used, then confirm them yourself. The AI chart analysis guide has a checklist for that step.
What is the difference between confirmation and invalidation?
Confirmation is the condition that makes a pattern count as complete, usually a close beyond a boundary. Invalidation is the condition that tells you the setup has failed, such as a close back inside the pattern. Both should be written before you enter a trade.
Sources and verification
Primary-source links used for the platform behavior and risk statements in this guide. Sources reviewed 7 November 2026.
- U.S. Commodity Futures Trading Commission: Futures Glossary · Reviewed
- UK Financial Conduct Authority: Understanding price graphs · Reviewed
- MetaQuotes: Analytical Objects · Reviewed
- MetaQuotes: View and Configure Charts · Reviewed