YoForex AI educational guides
Smart money concepts (SMC): definition, terms and limits
Smart money concepts is a set of chart-reading terms, not a proven method. SMC labels such as order block, liquidity pool and break of structure describe shapes and levels that traders mark on a price chart. Two traders can mark the same chart differently, so a label shows one reading of price, not a result.
Published · Updated · By YoForex AI Editorial Team
What are smart money concepts (SMC)?
Smart money concepts is a set of chart-reading terms, not a proven method. Traders who use the phrase say that large institutions leave traces in price, such as swing points they break and zones where price later returns. The terms that describe those traces are order block, liquidity pool, break of structure, change of character and fair value gap. The phrase is usually shortened to SMC, and searches for SMC in trading or smart money concept lead to the same subject.
The word “smart” is an interpretation. It assumes that large banks and funds move price in ways a chart can show. That assumption is hard to test in spot forex, because the market has no single central exchange and no central volume. On forex symbols, MetaTrader 5 shows tick volume, which the MetaQuotes Volumes help page describes as the number of price changes in each period, so the chart cannot show who placed an order. The terms work as a vocabulary for describing price. They are not evidence of who is behind a candle.
SMC also appears in search as a trading strategy. A strategy needs written entry, exit and risk rules. SMC gives you vocabulary and rules of thumb, and teachers do not agree on the details. If you build an SMC strategy, the rules are yours, and they need the same testing as any other strategy.
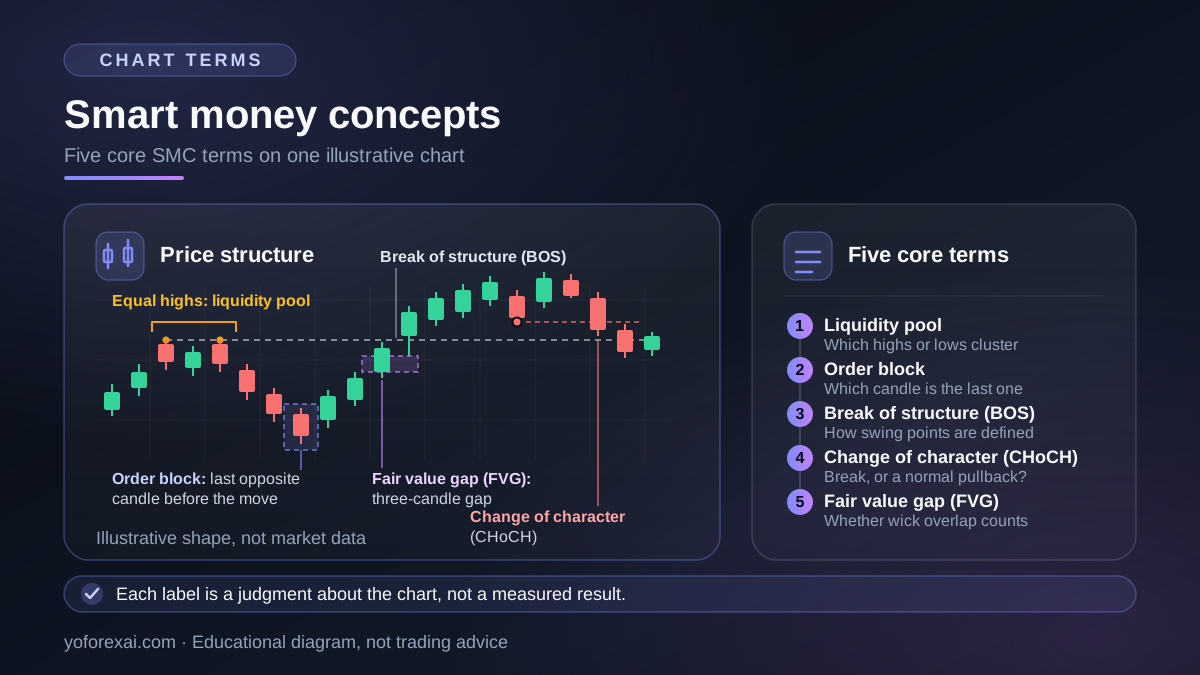
What are the core SMC terms?
The table gives the common description of each term. Teachers differ on the details, so treat each row as a starting definition. The last column names the step where a reader has to make a judgment.
| Term | How it is usually described | Where the judgment comes in |
|---|---|---|
| Order block | The last opposite candle before a strong move, marked as a zone. | Which candle counts as the last one, and how far the zone extends. |
| Liquidity pool | A cluster of highs or lows, such as equal highs, where stop orders are said to sit. | Which highs or lows count as a cluster, and how close together they must be. |
| Break of structure (BOS) | A close beyond a prior swing high or low in the direction of the trend. | How swing points are defined, and how many bars are used to define them. |
| Change of character (CHoCH) | A close beyond a prior swing against the current trend, often read as an early sign of reversal. | Whether the break is a change of character or a normal pullback. |
| Fair value gap (FVG) | A gap in price across three candles, where the middle candle moves quickly. | Whether a gap counts when the wicks overlap. See the fair value gap guide for the detail. |
Each term has a boundary, a direction and a time window. Until those are written down, two readers cannot check whether they agree. The fair value gap guide covers the three-candle definition in full, so this page keeps the FVG row short.
How do SMC traders read a chart?
The sequence below is a common teaching order. It is not a standard, and no exchange or regulator has set it.
- Choose a higher timeframe and mark the trend from its swing highs and lows.
- Mark the most recent break of structure on that timeframe.
- Locate an order block or fair value gap from the move that caused that break.
- Wait for price to return to that zone on a lower timeframe.
- Look for a reaction inside the zone, such as a rejection wick, before you consider an entry.
Each step contains a judgment. Step 2 depends on how a swing is defined, and step 3 depends on which candle counts as the last one before the move. A reader who changes either choice gets a different chart, even when the candles are the same.
Where does the subjectivity come in?
Two readers can start from the same candles and mark different zones. The table lists three choices that change the labels.
| Choice | Options a reader can pick | Effect on the label |
|---|---|---|
| Swing definition | The number of bars on each side of a high or low. | Decides which breaks of structure appear on the chart. |
| Zone boundaries | The candle body, the full wick range, or part of the range. | Changes the price levels a trader watches. |
| Timeframe | One timeframe, or several at once. | A zone on one timeframe can be noise on another. |
MetaQuotes describes trend lines and shapes in MetaTrader 5 as objects that you place by hand. Its analytical objects help page lists geometric shapes such as squares, triangles and ellipses for marking areas of a chart, and says that, unlike technical indicators, these objects are plotted manually. A zone drawn on MT5 is therefore a shape someone placed. It is not a value an indicator calculated, so two traders will rarely place it the same way.
The CFTC Futures Glossary defines charting as “the use of graphs and charts in the technical analysis of futures markets to plot trends of price movements.” That describes the general practice. The part of the glossary we read does not mention order blocks, liquidity pools or any other SMC term, so it does not confirm them.
What smart money concepts cannot tell you
The terms describe a chart. They do not provide the following.
- A hit rate. This guide gives no win rate, and the terms do not come with a measured one. A zone that held on past charts can fail on the next.
- The intent behind a candle. A labelled order block is a reading of price, not an order you can see. Spot forex has no central tape to confirm it.
- A final break. A break of structure or change of character can be followed by a return inside the range. The UK Financial Conduct Authority warns in Understanding price graphs that the timeframe or data shown in a price graph “may be selected to support a particular viewpoint rather than provide the full picture.”
- A risk limit. A stop placed just beyond a zone can be reached by a short spike. Position size and a loss limit decide how much you can lose, not the label.
The same FCA guidance on price graphs says that “past performance is not a reliable indicator of future results.” That applies to any zone you label after the move has already happened.
Risk warning. You can lose more than you deposit, depending on your broker and country. Leveraged forex positions can lose value quickly, and a zone you treat as support can give way on a single candle. Check the rules that apply to you with your own regulator or local authority before you trade any setup.
How should you test an SMC rule set?
Write each term as a rule before you test it. Give it a fixed swing definition, a fixed zone boundary, a timeframe and an invalidation level. Then label the chart the same way every time, and record each setup, including the ones you did not take.
Hypothetical example: a rule set produces 10 labelled zones on one chart. Two readers apply the same rule text and agree on 6 zones. They disagree on 4. Those four disagreements show that the rule is not yet specific enough to test, whatever happens to any trade.
Once the rules are fixed, a demo or paper record shows whether you apply them consistently. The paper trading guide explains what that record can and cannot show. If you code the rules into an Expert Advisor, test the coded version as its own rule set, because a coded zone can differ from a hand-drawn one. The EA evaluation guide lists the checks to run before you rely on one.
Supply and demand and support and resistance use similar boundaries. Compare the rules side by side with the supply and demand guide and the support and resistance guide. If you use breakouts, the chart patterns guide covers the confirmation rules for those. Overlap between methods is common, and the same zone can carry different names.
Key takeaways
- Smart money concepts (SMC) is a set of chart-reading terms, not a proven method.
- The core terms are order block, liquidity pool, break of structure, change of character and fair value gap.
- Each term depends on judgments about swings, zone edges and timeframe, so two readers can mark the same chart differently.
- An SMC label describes past price. This guide gives no hit rate for any SMC term.
- Write the rules first, and test them forward on a demo or paper record before you risk money.
Frequently asked questions
What does SMC stand for in trading?
SMC stands for smart money concepts. The same abbreviation is used for smart money concept. It is a group of terms for reading price structure, not an exchange or regulator standard.
Is smart money concepts a proven trading strategy?
No. It is a vocabulary for describing chart structure. A strategy built from it needs written entry, exit and risk rules, and those rules need testing. This guide gives no performance figure for SMC.
What is the difference between an order block and a fair value gap?
An order block is a zone drawn around the last opposite candle before a strong move, and teachers define it in different ways. A fair value gap is a gap in price across three candles, which has a narrower definition. The fair value gap guide gives the three-candle rule.
Is SMC the same as price action?
Price action is a wider term for reading candles, levels and structure without relying on indicators. SMC uses a specific set of names for some of those features, and it adds an interpretation of which participants cause the moves. Some labels overlap, but the names and the cause assumption are not the same.
Can an Expert Advisor trade smart money concepts?
An Expert Advisor can follow only the SMC rules that its author has coded, and the coded rules need to be tested as their own rule set. Check the documented rules, the inputs and the test results before you rely on one. The EA evaluation guide lists those checks.
Sources and verification
Primary-source links used for the platform behavior and risk statements in this guide. Sources reviewed 9 November 2026.
- U.S. Commodity Futures Trading Commission: Futures Glossary · Reviewed
- UK Financial Conduct Authority: Understanding price graphs · Reviewed
- MetaQuotes: Analytical Objects · Reviewed
- MetaQuotes: Volumes · Reviewed