YoForex AI educational guides
Fair value gap (FVG): definition, three-candle rules and limits
A fair value gap (FVG) is an empty space on a price chart, usually in a three-candle sequence, where the outer candles' price ranges do not overlap. Traders use the term to mark fast price moves. The label describes a shape. It does not show that price will return to the gap.
Published · Updated · By YoForex AI Editorial Team
What is a fair value gap?
A fair value gap is a blank area on a price chart that a fast move leaves behind. It appears when the range of one candle does not overlap the range of the candle two positions before it. Traders often shorten the term to FVG. Some also call the same area an imbalance, although the two labels are not standard definitions.
The term is informal. The MetaQuotes help pages we opened for this guide do not define it, and neither does the FCA price-graph page we opened. The rules in this guide describe one common way chart readers mark the pattern. Two people can read the same chart and mark different zones, so write your own definition before you start marking.
The candles on your chart also depend on your platform. MetaQuotes states that bars in MetaTrader 5 are formed from Bid prices, or from Last prices for instruments with depth of market. A gap is measured on the candle data your chart shows, so a gap on another broker's chart, or on a chart with a different price source, can look different.
How do you spot a fair value gap on three candles?
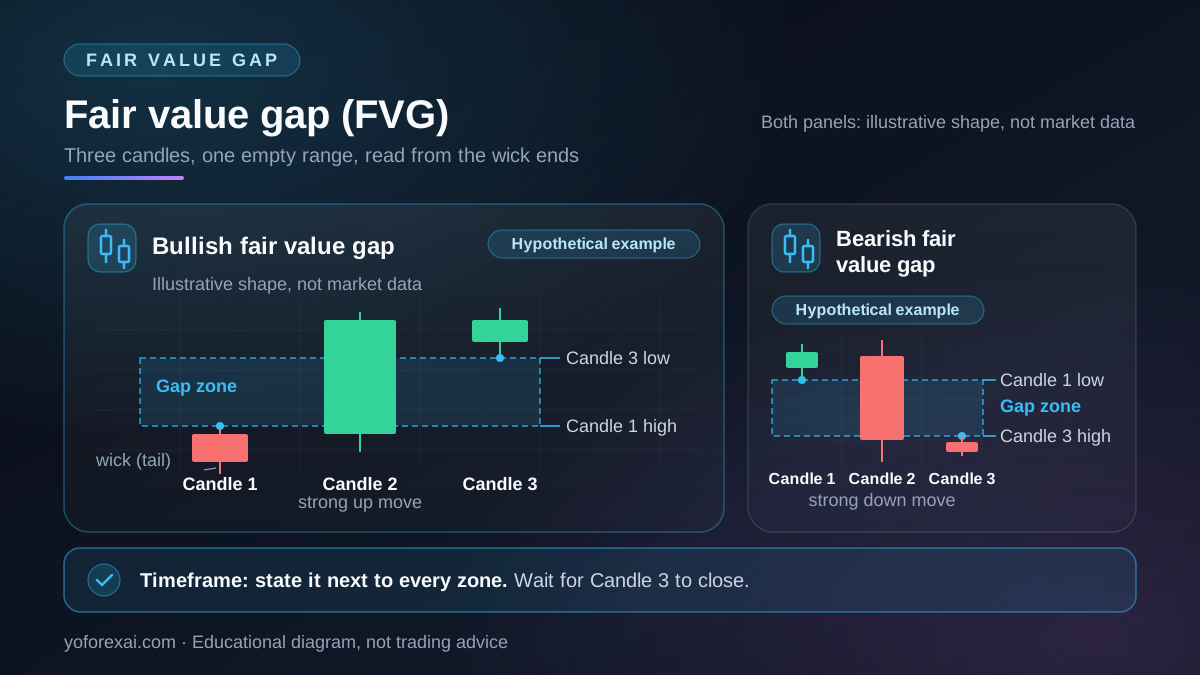
The pattern uses three consecutive candles on one chart. Number them from left to right: candle 1, candle 2, and candle 3. Candle 2 is the middle candle, usually a strong move in one direction. The gap sits between candle 1 and candle 3, not between the bodies of the candles.
In a bullish fair value gap, the high of candle 1 sits below the low of candle 3. The empty range between those two prices is the gap. In a bearish fair value gap, the low of candle 1 sits above the high of candle 3, and the gap is the empty range between them. Use the wick ends, which MetaQuotes calls tails, rather than the bodies, because the body alone can hide the true extremes of each candle.
Wait for candle 3 to close before you mark the gap. The gap is defined only when all three candles exist, and a zone drawn on a candle that is still forming can change as the candle moves.
What are the rules for marking a fair value gap?
Write the rules down before you look at past charts. The table below sets out the checks this guide uses. It describes a method. It does not claim that a marked gap will behave in a particular way.
| Check | Bullish fair value gap | Bearish fair value gap | Why it matters |
|---|---|---|---|
| Candle sequence | Three consecutive candles, with candle 2 a strong up move. | Three consecutive candles, with candle 2 a strong down move. | Candle 2 is the move that leaves the gap. |
| Gap condition | The low of candle 3 is above the high of candle 1. | The high of candle 3 is below the low of candle 1. | This is the no-overlap test. If the ranges overlap, there is no gap. |
| Zone edges | Lower edge: candle 1 high. Upper edge: candle 3 low. | Upper edge: candle 1 low. Lower edge: candle 3 high. | The edges define the zone you watch. Write them down with the price values. |
| Timeframe | State the timeframe next to the zone. | State the timeframe next to the zone. | The same market can produce different gaps on different timeframes. |
How does a fair value gap differ from a supply and demand zone?
A supply and demand zone marks the area where price left a base before a strong move. A fair value gap is narrower. It is a missing overlap across three candles. The two can appear on the same chart in the same place, and that overlap can make a chart look more informative, but one shape does not prove the other.
If you use both ideas, keep them as separate observations. Mark the supply or demand zone with its own rule, then mark the gap with its own rule, and record whether the two areas overlap. The supply and demand guide explains how those zones are drawn and why the drawing is subjective.
Does the timeframe change a fair value gap?
Yes. Three candles on a one-minute chart are a different set of prices from three candles on a one-hour chart, so the zones are not interchangeable. Choose the timeframe you use for the decision, mark the gap on that timeframe, and write the timeframe beside the zone. If you check a higher timeframe for context, mark that gap separately.
MetaQuotes lists bars, Japanese candlesticks and a broken line as chart display options, and says the chart type can be changed from the Charts menu or from the chart properties. Gap detection needs candles or bars, because a line chart shows only one price per point and hides the high and low of each candle.
Some gaps on a chart come from breaks in the data, such as session boundaries, weekend reopenings or news releases, when the next candle opens far from the previous close. Note the cause when you mark a zone. A gap caused by a data break is a different observation from a gap made by a fast move during a session.
What can a fair value gap not tell you?
Read this section before you use the concept in a trade plan. Each point is a limit on what the pattern can support.
- It does not give direction on its own. A bullish gap is a shape on past candles. It is not a forecast.
- It does not show that price will return to the zone. The MetaQuotes and FCA pages we opened do not test how often price returns to a fair value gap. The idea that price will return is a belief among some chart readers, not a tested rule.
- Marking is subjective. Two traders can agree on the three candles and still draw different edges if one uses wicks and the other uses bodies.
- The chart shows one price series. Bars in MetaTrader 5 are formed from Bid prices, so a gap on another price source can look different.
- The timeframe or data can be chosen to support a view. The FCA warns that the timeframe or data shown on a price graph may be selected to support a particular viewpoint rather than provide the full picture.
- Hindsight looks clean. A zone found after a move looks obvious. Mark zones before you know what happened next, and keep the record.
How should you test a fair value gap rule?
Write the rule as a checklist: the candle count, the gap condition, the zone edges, the timeframe, and what you will do if price trades through the zone. Then record every gap you mark, including the ones you would not trade, and review the record after a fixed period. Reviewing only the clearest examples measures your eye, not the rule.
A demo account or a paper record can show whether you apply the rule consistently. It cannot show live fills, spread changes around a gap, or the emotional pressure of a real loss. The paper trading guide explains those limits in more detail.
The gap rules sit next to other chart ideas that traders use. The smart money concepts guide lists fair value gaps as one term among several, and the chart patterns guide explains how a pattern is confirmed by a close rather than a touch. Keep each rule separate when you test it.
Risk warning. You can lose more than you deposit, depending on your broker and country. A fair value gap is not a level where a stop is guaranteed to work. Price can open beyond a stop after a gap, so a loss can be larger than the amount you planned to risk. Check the rules that apply to you with your own regulator or local authority.
Key takeaways
- A fair value gap is an empty range left by three candles, where the outer two candles do not overlap.
- Mark it from the wick ends of candle 1 and candle 3, on a fixed timeframe, after candle 3 closes.
- The term is informal and varies between chart readers, so write your own definition down.
- A marked gap does not show that price will return to it.
- Test the rule forward, keep a record that includes the setups you did not trade, and check your regulator's rules before you use leverage.
Frequently asked questions
What is an FVG in trading?
FVG stands for fair value gap. It is the empty range between candle 1 and candle 3 in a three-candle sequence where the outer candles do not overlap. Traders use it as a label on a chart, not as a standard measure.
Do fair value gaps always get revisited?
No source we opened for this guide tests that claim, and it is not a rule. Treat any statement that price always returns to a gap as an untested belief, and do not build a plan that depends on it.
Is a fair value gap the same as an imbalance?
Some traders use the two terms as if they were the same, but neither has a standard definition from a regulator or a platform provider. Use the term your own rule defines, and write the definition next to every zone you mark.
Can I mark fair value gaps by hand on MetaTrader 5?
You can mark the zone yourself with a drawing object, such as a rectangle, placed on the candles you have chosen. Record the price values and the timeframe with the drawing so that you can check it later.
How can AI help with fair value gap analysis?
An AI model can describe the candles it used, but its labels need checking against the chart. Ask it to name the three candles and the high and low of each, then compare those values with your chart. The AI forex chart analysis guide covers that check step by step.
Sources and verification
Primary-source links used for the platform behavior and risk statements in this guide. Sources reviewed 9 November 2026.
- UK Financial Conduct Authority: Understanding price graphs · Reviewed
- MetaQuotes: Chart Settings · Reviewed
- MetaQuotes: View and Configure Charts · Reviewed