YoForex AI educational guides
Support and resistance trading: how to draw levels, then check them with AI
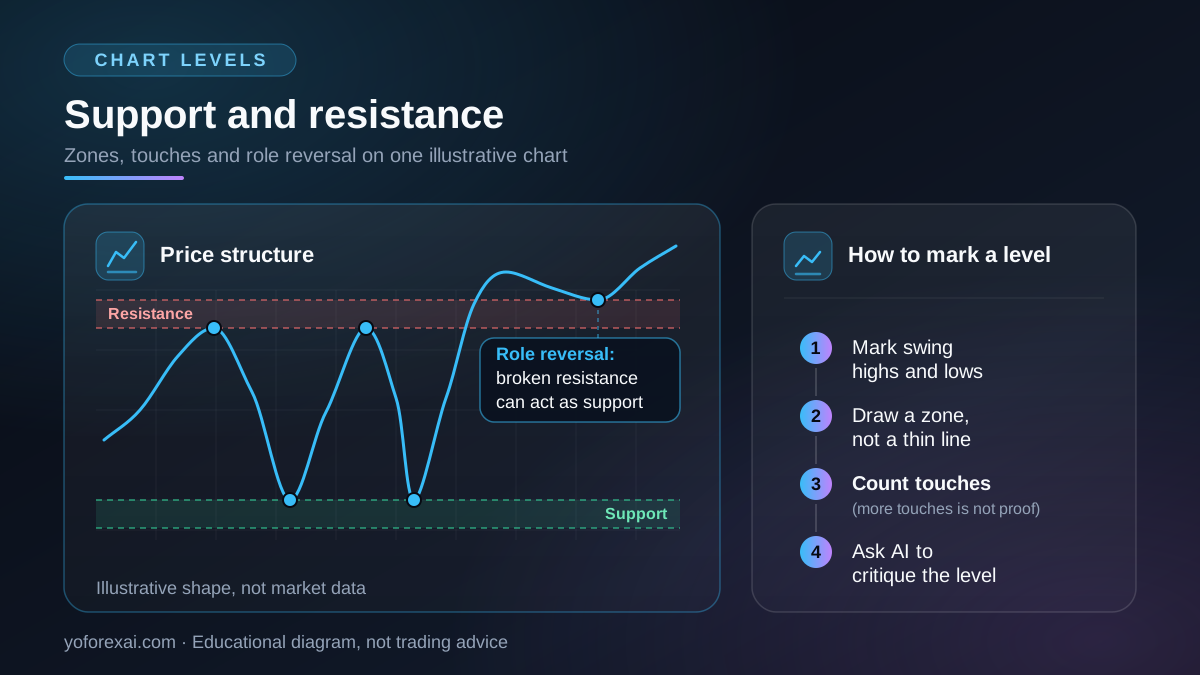
Support and resistance are price levels where the market has repeatedly paused, reversed, or stalled. Support sits below price and can attract buying. Resistance sits above price and can attract selling. Levels are drawn by judgment, so treat them as zones to test, not guaranteed turning points or exact prices.
Published · Updated · By YoForex AI Editorial Team
Support and resistance trading is a way of marking price areas where buyers or sellers have shown up before. The idea is simple. If price turned near a certain area several times in the past, traders may watch that area again when price returns. The method is widely used in forex, but it depends heavily on how the levels are drawn, so the drawing process matters as much as the idea.
What are support and resistance levels?
Support is a price area where buying has repeatedly appeared and slowed a decline. Resistance is an area where selling has repeatedly appeared and slowed a rise. Traders mark these areas because they show where past decisions clustered. They do not show where price must go next, and a level that held in the past can fail on the next test.
A useful idea is role reversal. Resistance that price breaks decisively can later act as support on a pullback. Support that gives way can later act as resistance. The change in role is a reason to watch the area again. It is not a guarantee that the level will hold.
Support and resistance trading: how to draw the levels
Most levels are drawn by hand. The process is easier to repeat when you follow the same order on every symbol and timeframe you study. Keep the chart clean, and write down the rule behind each line you keep.
- Mark swing highs and lows. Scroll back over the chart and mark the points where price turned clearly. A swing high has lower prices on both sides. A swing low has higher prices on both sides.
- Draw a zone, not a thin line. Price rarely returns to the exact same tick. Draw a band that covers the wicks and the nearby closes where the reaction happened. A narrow band is easier to test. A very wide band says very little.
- Count touches, but do not treat the count as proof. Note how many separate times price reacted inside the zone. The section on touches explains why this number is weak evidence on its own.
- Ask an AI tool to critique the level. Use a second reader to look for weak drawings, missed levels, and levels that are too close together. Then decide with your own review of the chart.
The MetaQuotes help page on analytical objects explains that horizontal lines are plotted with a single click, while trendlines and other objects that run along a trend need a second point. The same help system describes how to view and configure charts, including saving a chart template so drawn levels can be restored later.
Which support and resistance levels do traders use?
Not every level comes from the same source. The table lists common types, how each is usually found, and the weakness that matters most in practice. The categories overlap. A round number can also be a prior swing high, and that overlap is often a reason traders watch it.
| Level type | How it is usually found | Main weakness |
|---|---|---|
| Horizontal swing level | A previous swing high or low, drawn as a zone. | Choosing which swing matters is subjective. |
| Trendline | Two or more swing points joined by a sloped line. | Easy to over-fit. A steep line is often broken. |
| Round number | A price such as a whole figure or a half figure, chosen to suit the symbol. | Many people watch the same numbers, so reactions can be noisy. |
| Pivot level | Calculated from the prior session's high, low, and close. | The formula is fixed, but relevance to today's market varies. |
| Previous day high or low | The high or low of the prior trading day. | Relevance often fades within a few sessions, though this varies by market. |
| Moving average as a dynamic level | An average line that price has tended to revisit. | The average lags price and changes with its period setting. |
Choose the type before you draw. A trendline and a horizontal zone answer different questions. The first asks whether a slope is still being respected. The second asks where price reacted in the past. Higher timeframes often deserve more attention than lower ones, because they usually take longer to form. That is a general observation, not a rule.
Hypothetical example: a trader marks a zone at a prior swing low on a four-hour chart of a major currency pair. Later, price drops into the zone, reacts, and returns twice more. The trader records the zone, each touch, and what happened next. If the zone fails on a later test, that record is still useful. It shows where the method was wrong.
Supply and demand zones are a related but separate method. The supply and demand guide compares the two. Shapes that form across several levels, such as triangles and flags, are covered in the chart patterns guide.
How many touches make a support or resistance level?
Many articles say a level needs two, three, or four touches to be valid. Treat that as a rule of thumb, not as evidence. Two touches can be a coincidence. Five touches can mean the level is crowded, or that each test has used up part of the reaction that made it useful. A level can be retested many times and then break.
Use touches as one input among several. Stronger context usually includes a clear reaction at the zone, a recent test that matches the current market conditions, and a boundary that is easy to draw without stretching. A level with many old touches and no recent reaction may be less useful than a fresh level with one strong rejection. Write down the reason you kept each level, so you can review it later.
Can an AI chart reader check your levels?
Once the levels are drawn, an AI chart reader can act as a second reviewer. Give it the symbol, the timeframe, a screenshot with the time scale visible, and one specific question, such as which zone has the most recent reaction and what would invalidate it. The answer is a draft to test, not a verdict. The AI forex chart analysis guide explains how to prepare the chart and check the output.
An AI tool can list the levels it sees, point out which zones sit close to current price, flag a level you may have ignored, and warn when the drawing has too many lines to be useful. It cannot confirm how a level will behave. It only sees what is on the screenshot, and it can misread prices, scales, or timeframes. Compare every level it names with the chart yourself before you use it.
What are the common mistakes?
The most common mistake is drawing too many lines. A chart with twenty horizontal lines does not contain more information than one with three. Each extra line gives you another reason to justify any trade you already wanted to take. Other frequent errors include:
- Drawing levels after the move, so every level looks obvious in hindsight.
- Moving a level to fit a trade you have already decided to take.
- Treating a broken level as permanent, or a tested level as certain.
- Using one timeframe only and ignoring the larger context.
- Entering without a stop or exit rule because the level “should hold”.
Risk note: a support or resistance level can fail, and price can move through it quickly, especially around scheduled news or when liquidity is thin. Decide the size of a loss before you enter. Placing a stop beyond a zone is a common approach, but a stop is not a guaranteed limit. Prices can gap past it, and spreads can widen. Your broker's execution and your own position size define the real risk.
Test the method before you risk money. The paper trading guide explains simulated practice and its limits. You can also see the product on the live demo page. Neither is a record of trading results, and a few good levels do not show that a method works.
Key takeaways
- Support and resistance are areas where price has reacted repeatedly. They are not exact prices that must hold.
- Draw levels as zones, starting from swing highs and lows, and keep the chart uncluttered.
- Touch counts are weak evidence on their own. Look at recent reactions and context too.
- A broken level can change role, but role reversal is not a guarantee.
- Use an AI reader to critique your drawing, then check every level on the chart yourself.
- Define your loss in advance, and test the method on paper or a demo account before risking money.
Frequently asked questions
Is support and resistance trading reliable?
No method is reliable enough to justify risking money on its own. Levels show where price reacted in the past, and markets can move through them at any time. Judge the method by recording many levels, the reason for each, and the outcome of each, over a defined period. Include the misses in that record.
How many times does price need to touch a level?
There is no fixed number. Two, three, or four touches are common rules of thumb, but none is proven. The number of touches matters less than the quality of each reaction, how recent the reactions were, and whether the level is still clear on the chart.
Which timeframe should I use to draw levels?
There is no single best timeframe. Higher timeframes usually show levels that more participants may watch, but they change less often. Lower timeframes produce more levels and more noise. Start with one timeframe you can review fully, and check a higher timeframe for context before you act.
Can AI find support and resistance levels accurately?
AI can list candidate levels quickly, but it can misread prices, scales, and timeframes. Compare each level it names with the chart and the exact price scale. Treat its output as a critique to check, not as a source of truth.
Should I trade every level I draw?
No. Most levels will not give you a setup you would want to take. Decide in advance which reactions you accept, such as a specific reaction at a specific zone with a defined stop and size. Skip everything else, and record the skipped levels too, so you can see whether your filter helps.
Sources and verification
Primary-source links used for the platform behavior and risk statements in this guide. Sources reviewed 7 November 2026.
- MetaQuotes: View and Configure Charts · Reviewed
- MetaQuotes: Analytical Objects · Reviewed