YoForex AI educational guides
Supply and demand trading explained for forex
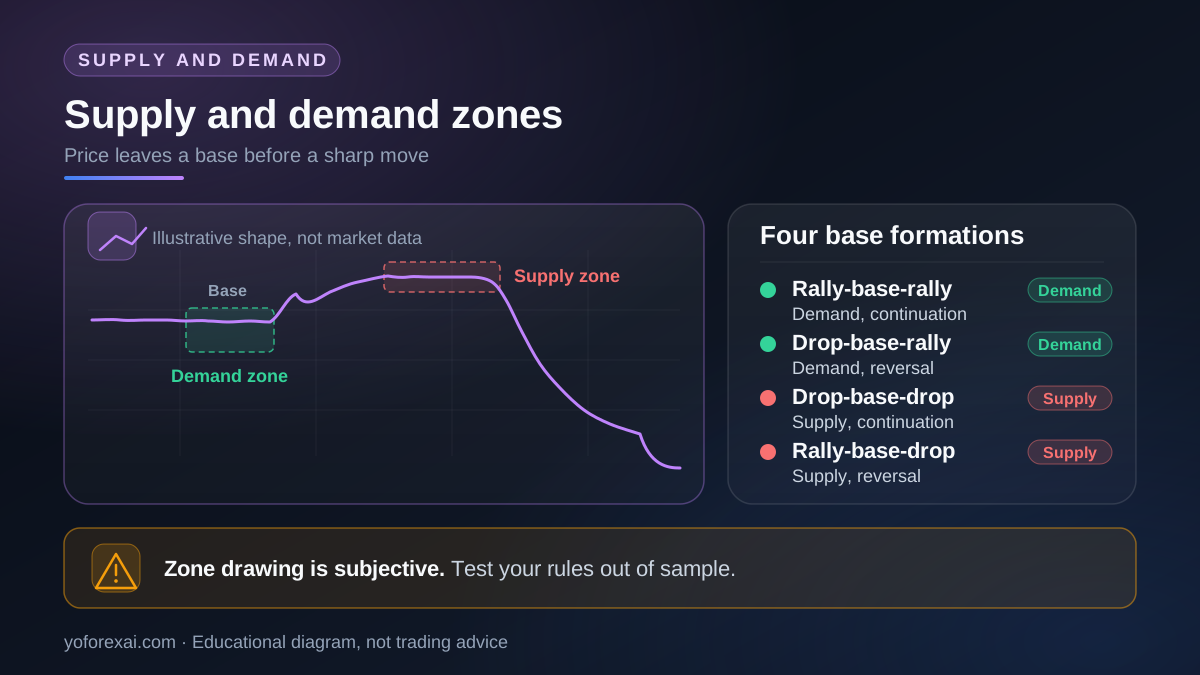
Supply and demand trading is a chart method that marks price zones where a sharp move started from a small base of consolidation. A demand zone forms before a rally and a supply zone before a drop. Traders watch these zones for reactions. Drawing them is subjective, so write rules, define invalidation, and test them before risking money.
Published · Updated · By YoForex AI Editorial Team
What is supply and demand trading?
Supply and demand trading is a method of reading price charts. It looks for areas where price paused for a short time and then left that area with force. Traders call those areas zones. A demand zone marks a base where buying pressure appeared to outweigh selling. A supply zone marks a base where selling pressure appeared to outweigh buying. The method uses price and time, with few or no indicators.
The idea is easy to state and harder to apply. Every chart has pauses and sharp moves, so the work is deciding which ones count. This page turns those decisions into rules. It does not claim that zones predict direction or that large participants leave visible footprints.
How are supply and demand zones different from support and resistance?
Support and resistance marks a price level where price has reacted before. A supply or demand zone is wider and is built from a specific base and the move that followed it. If you already use support and resistance levels, the zone method adds a rule about what happened when price left the area.
| Feature | Support and resistance | Supply and demand zones |
|---|---|---|
| Shape | A line or a thin band at one price level. | A rectangle that covers the base candles. |
| How it is built | From prior swing highs and lows where price turned. | From the base and the sharp move that left it. |
| Width | Narrow, sometimes a fixed band. | Sized by the base candles, so it varies from chart to chart. |
| Key question | Has price reacted at this level before? | Did price leave the base with force, and has it returned? |
| Main weakness | Many lines can be drawn on one chart. | Drawing is subjective, and a zone can be too wide to be useful. |
| Testing approach | Count touches, breaks, and reactions. | Write rules for base size, move size, edges, and invalidation. |
The zone method has its own weakness. Because the zone includes the base candles, its edges depend on how you measure them. A wide zone can cover most of the recent range, and a narrow one can miss the reaction completely.
How do you draw a demand zone?
A demand zone forms at the base of a strong move up. Follow these steps on one timeframe, then write the same steps as rules in your notes.
- Find the sharp move. Define sharp in advance. One example rule is a candle body larger than the average body of the previous 20 candles.
- Find the base. Look for the small-bodied candles just before the move. Decide how many candles count as a base, and keep that number fixed for every test.
- Choose the edges. Decide whether the zone uses candle bodies or full wicks. Use the same choice on every chart you test.
- Draw the rectangle. Cover the base from its lower edge to its upper edge. Extend the right side only as far as your rule allows.
- Set invalidation. Mark the level beyond the zone where, under your rules, the zone is no longer valid. For a demand zone this is normally below the lower edge.
- Record the zone. Save the symbol, timeframe, date, zone edges, and the rule that created it.
How do you draw a supply zone?
A supply zone mirrors the demand method. It forms at the base of a sharp move down. Apply the same six steps with the directions reversed: find the sharp move down, find the base before it, choose the edges, draw the rectangle, set invalidation above the zone, and record the result.
Use the same thresholds for both sides. A method that applies a strict rule to demand zones and a loose rule to supply zones can end up matching the trend you already expected, rather than the price behavior you meant to test.
Which base formations do traders describe?
Traders often group zones by the sequence of moves before and after the base. The four labels below describe the sequence of price moves. They are not a forecast.
| Formation | Zone type | Sequence | What to watch |
|---|---|---|---|
| Rally-base-rally | Demand | Price rises, pauses, then rises again. | A pause that is too long or too wide can weaken the rule. |
| Drop-base-rally | Demand | Price falls, pauses, then rallies sharply. | Whether the rally meets your definition of a sharp move. |
| Drop-base-drop | Supply | Price falls, pauses, then falls again. | A base that is broken repeatedly, which suggests it is not a stable base. |
| Rally-base-drop | Supply | Price rises, pauses, then falls sharply. | A pause that turns into another rally before the drop. |
Why do zones fail, and how do you define invalidation?
A zone fails when price closes beyond its invalidation level. The rule should be set before the trade, not after price moves against it. A zone is a reference area, not a guaranteed turning point.
Consider this hypothetical example, which is not market data. A demand zone sits between 1.1000 and 1.1020 on a one-hour chart. The written rule places invalidation 10 pips below the lower edge, at 1.0990. If a candle closes below 1.0990, the zone is marked invalid and the plan is cancelled. The example does not show what would have happened next, and it does not suggest that the zone is likely to hold.
Common reasons zones fail:
- The base was not a real base, and the rule accepted a single candle.
- The zone was too wide to be useful, so almost any price action touched it.
- A scheduled news release or a gap moved price through the zone.
- Spread, slippage, or a wider spread at a volatile moment changed the outcome.
- Too many zones were on the chart, so the trader chose the one that matched the view.
Zone drawing is subjective, so two people can mark different zones on one chart. Give your written rules to a second person and check whether they draw the same zones.
How do you test supply and demand zones on history?
Testing turns a chart idea into a measurable rule. Write the entry, exit, stop, zone definition, timeframe, symbols, test period, and cost assumptions before you look at results. Then split your history into two parts. Use the first part to refine the rules. Use the second part once, without changes, to check them. This second part is called out-of-sample data. If you change a rule after you see the out-of-sample result, that period has become part of the development process, and it no longer proves much.
Manual testing is slower but shows the reasoning. Mark each zone and signal, and record the outcome under the same rule. The guide on what paper trading is explains the limits of simulated fills.
Automated testing requires code. MetaQuotes documents its Strategy Tester in its strategy testing help. The page describes several tick generation modes. The “Every tick” mode simulates all ticks and is the most accurate and slowest of the listed modes. The “1 minute OHLC” mode emulates only the four prices of each minute bar. A zone rule that depends on the order of price moves inside one minute can give misleading results in that mode, so choose the mode that matches the rule.
After a test, read the full report, not only the net profit. The MetaQuotes Testing Report page lists fields such as Total Trades, Profit Factor, Equity Drawdown (absolute, maximal, or relative), and History Quality. The evaluation guide explains how to read those fields for an Expert Advisor.
| Element | What to record | Why it matters |
|---|---|---|
| Rule set | Exact zone, base, and invalidation rules, with a version number. | Prevents rules from changing after the results are seen. |
| Market and timeframe | Symbol, broker, timeframe, and session times. | A zone can look different on another timeframe or broker feed. |
| Test period | Dates for the development part and the out-of-sample part. | Separates refining the rules from checking them. |
| Costs | Spread, commission, swap, and assumed slippage. | Small costs can decide whether a thin edge exists at all. |
| Sample size | Number of zones, trades, wins, and losses. | Small samples are unreliable, whatever the result. |
| Failures | Every invalidated zone and every stop that was hit. | Stops the review from selecting only the good examples. |
Can AI help you mark a zone?
An AI chart tool can describe price structure or suggest candidate zones. Treat its answer as a claim to check, not as a finding. Ask it to state the base candles, the zone edges, and the invalidation level, then confirm each one on your own chart. The AI chart analysis guide sets out a fuller workflow.
Risk disclosure
Supply and demand trading is an interpretation of price, not a guarantee of direction or profit. Zones can fail, prices can gap through them, and spreads and swaps add cost. Forex and other leveraged products can cause losses larger than an intended stop suggests. Margin and leverage rules depend on your broker and your country. Read the leverage and margin guide before you trade, and check the rules set by your own regulator. Nothing on this page is a personal recommendation, and the examples are hypothetical.
Key takeaways
- A supply or demand zone marks a base followed by a sharp move. It is a reference area, not a forecast.
- Write the rules for the base, the sharp move, the zone edges, and invalidation before you draw any zone.
- Zone drawing is subjective. Check whether a second person following your rules draws the same zones.
- Set invalidation in advance, and record every zone that fails.
- Split history into a development period and an out-of-sample period. Do not change rules after seeing the check.
- Check any AI or human zone against your own rules before you risk money.
Frequently asked questions
Is supply and demand trading a proven strategy?
No. The sources reviewed for this page do not show independent evidence that zones give an edge. The method can be tested. A fair test uses fixed rules, out-of-sample data, and realistic costs. Until your own test supports the method, treat it as a hypothesis.
Do large banks or institutions create these zones?
That explanation is common in marketing material, but it is an interpretation. This page does not rely on it, and none of the sources reviewed here confirm it. A zone rule should be judged by its test results, not by who is supposed to have placed the orders.
What is the difference between a supply zone and a resistance level?
A resistance level is usually a price level where price has reacted before. A supply zone is an area built from a specific base and the sharp move that left it, drawn with written edges.
Which timeframe should I use for supply and demand zones?
The method works on any timeframe, but a zone on a higher timeframe is usually wider and covers more time. MetaQuotes lists 21 timeframes in its chart documentation, from one minute to one month. Pick one timeframe for the rule, test it, and record the choice.
Can an Expert Advisor trade supply and demand zones?
Only if every rule is defined precisely enough for code, including the base size, the sharp-move threshold, the edge choice, and invalidation. Manual drawing is subjective, so a coded version forces the rules into the open. Test the code with the steps in the evaluation guide before you run it on any account.
Sources and verification
Primary-source links used for the platform behavior and risk statements in this guide. Sources reviewed 7 November 2026.
- MetaQuotes: Strategy Testing · Reviewed
- MetaQuotes: Testing Report · Reviewed
- MetaQuotes: View and Configure Charts · Reviewed