YoForex AI educational guides
Volume spread analysis (VSA): bar types, tick volume and limits
Volume spread analysis (VSA) is a chart-reading method that compares each bar’s volume, its high-to-low spread and where it closes. It is a practitioner method, and this guide cites no official standard or validated test for it. On MetaTrader 5 forex charts, the volume it uses is tick volume, which counts price changes within each bar.
Published · Updated · By YoForex AI Editorial Team
What is volume spread analysis (VSA)?
VSA is a method for reading a price chart one bar at a time. On each bar it compares three things: how much volume was recorded, how wide the bar is from its high to its low, and where the bar closed inside that range. Traders who use VSA look for combinations that seem to show whether buyers or sellers are in control. This guide does not cite an official rulebook for VSA, so the readings here are practitioner conventions, and two traders can read the same bar differently.
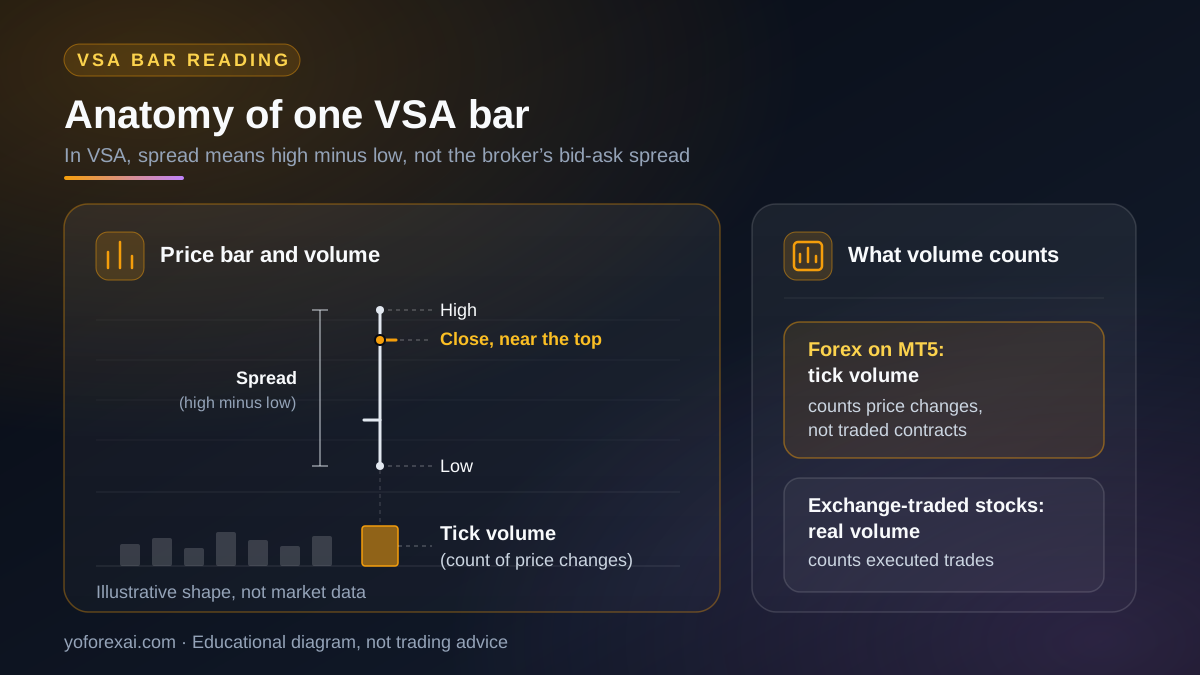
VSA uses one term in a special way. Its “spread” is the distance from the high of a bar to the low of that bar. It is not the bid-ask spread your broker charges on each trade. Keep the two apart when you read a VSA text or a chart label, because mixing them up confuses trading cost with market activity.
What volume does VSA use on MetaTrader 5 forex charts?
The CFTC foreign currency trading page describes its rules as covering off-exchange retail foreign currency transactions. A retail forex chart therefore has no exchange volume to show for EURUSD, and MetaTrader 5 gives forex charts a volume measure based on price activity instead.
MetaQuotes describes this in its help for the Volumes indicator. For forex, the indicator counts the number of price changes in each period of the selected timeframe. For stock symbols, the same indicator shows the volume that was actually traded. The MetaTrader 5 Volumes help page sets out both cases.
The chart settings help makes the split explicit. It describes tick volume as the volume chart calculated from the number of ticks, and real volume as the volume calculated from the actual number of executed trades. It states that real volume is only available for exchange-traded instruments. The MetaTrader 5 chart settings help page gives both definitions.
For most spot forex symbols on MT5, then, the volume bar is a count of price changes, not a count of contracts. A tall tick-volume bar tells you that the price changed often during that bar. It does not tell you how many lots changed hands or which institutions were involved. On MT5, tick volume is an approximation of activity, not a count of traded money. Tick counts come from your broker’s quote feed, so compare charts from the same broker.
How do you read each VSA bar type?
VSA texts usually sort bars by three inputs: volume compared with recent bars, spread compared with recent bars, and the close position inside the bar’s range. The table below gives the common reading for four combinations. Each row describes a practitioner convention, not a sourced fact. None of them is a validated signal.
| Bar type | What the inputs show | Common VSA reading | What it does not prove |
|---|---|---|---|
| Wide spread, high volume, close near the high | Price moved far, activity was heavy, and the bar held its gains. | Often read as demand taking control. | It does not show who was buying. The next bars give the context. |
| Wide spread, high volume, close near the low | Price moved far, activity was heavy, and the bar gave back its range. | Often read as supply taking control. | A news spike or a stop-driven move can produce the same bar. |
| Narrow spread, high volume | Activity was heavy, but price moved little. | Often read as one side absorbing the other. | A range pause or uneven feed updates can look the same. |
| Narrow spread, low volume | Activity was light, and price barely moved. | Often read as a lack of interest or a pause before a move. | A quiet bar does not, by itself, prove a lack of interest. |
Here is a hypothetical example, with made-up numbers, so you can see how the inputs fit together. Hypothetical example: a one-hour EURUSD bar has a range of 18 pips. The average range of the last 20 bars is 10 pips. The tick volume on the bar is 3,400, against a 20-bar average of 1,500. The bar closes in the top fifth of its range. In VSA terms this is a wide-spread, high-volume bar that closed high. The reading is a description of the bar, not a forecast. The bars after it decide whether the reading held.
How does VSA read a bar in context?
A single bar rarely tells you much. The reading gets more useful when you place it inside a sequence and inside a place on the chart. A simple routine is below. Write it down before you start, so you cannot change the rules after a result.
- Compare each bar with the average of recent bars, such as the last 20, not with the bar before it alone.
- Note where the bar sits. A wide-spread bar at a known level means something different from the same bar in the middle of a range. The support and resistance guide explains how to mark those levels as zones.
- Check the bars that follow. In VSA texts, a reading is usually checked against the next few bars, not only the bar that prompted it.
- Record the timeframe and the symbol with each observation, so you can compare like with like.
If you use an AI tool to describe a chart, the same rule applies. The model can name a bar type, but you still need to check its reading against the candles it used. The AI forex chart analysis guide covers that check.
How does VSA compare with other volume tools?
Other volume tools also use the volume figure on your chart. On MT5 forex charts they inherit the same limit: the volume is a count of price changes, not traded contracts. The on-balance volume guide shows how a running volume total is built, and the VWAP guide explains a price average weighted by volume from a session start. Both depend on the same tick count, so the caveat in this guide applies to them too.
What VSA cannot tell you
VSA is easy to describe and hard to test. These limits matter before you use it on real money.
- It is not a validated method. This page does not cite an official rulebook for VSA; the readings in the table are practitioner conventions. A bar label is an interpretation.
- Tick volume is not traded volume. A taller bar can mean more price changes, not more money moving through the market.
- It cannot show who is trading. Labels such as “professional” or “institutional” are guesses drawn from bar shapes. The chart does not identify the participants.
- It cannot set a target or a holding period. A bar reading says nothing about how far price will move or how long a trade should last.
- Sessions and news change how you read a bar. Note the session and any scheduled release near the bar before you read it, and treat a bar inside a news window with extra caution.
- Broker feeds differ. A tick count comes from one broker’s quote stream, so compare charts from the same broker.
Risk warning. You can lose more than you deposit, depending on your broker and country. Forex trades are often made with leverage, and that can magnify a loss quickly. A VSA reading is a judgment about past bars, and a setup that looks clear can fail on the next bar. Check the rules that apply to your account with your own regulator before you trade.
Key takeaways
- VSA reads each bar by its volume, its high-to-low spread and its close. It is a discretionary method with no formal standard.
- On MetaTrader 5 forex charts, the volume shown is tick volume, which counts price changes. It is not traded contracts.
- Real volume, which counts executed trades, is only available on exchange-traded instruments.
- Read a bar against recent averages and the bars that follow it, and write the rules down first.
- VSA cannot show who is trading, how far price will move, or how long a trade should last.
Frequently asked questions
What does VSA stand for in trading?
VSA stands for volume spread analysis. It is a chart-reading method that compares each bar’s volume, its high-to-low spread and its close. Some traders also use the abbreviation for other things, so check the context of any text you read.
Does volume spread analysis work on forex?
Traders apply it to forex charts, but retail forex is traded off-exchange, so MT5 shows tick volume, which counts price changes. That makes VSA readings a judgment about price activity, not a measure of traded money. This guide cites no source that shows the method works on forex, so test it yourself.
Is tick volume the same as real volume?
No. MetaQuotes describes tick volume as the volume calculated from the number of ticks, and real volume as the volume calculated from executed trades. Real volume is only available for exchange-traded instruments, so most forex symbols on MT5 show tick volume.
Is VSA a trading strategy?
VSA is a reading method. A strategy needs written entry, exit and risk rules, and a test of those rules. You can build a strategy that uses VSA readings, but the method itself does not give you the rules.
Can an AI tool read VSA bars for me?
An AI tool can describe the bars you show it, but its reading still needs checking. Ask it which bars it used, compare the spread and volume figures with the chart, and check the next few bars before you act on any label.
Sources and verification
Primary-source links used for the platform behavior and risk statements in this guide. Sources reviewed 9 November 2026.
- U.S. Commodity Futures Trading Commission: Foreign Currency Trading · Reviewed
- MetaQuotes: Chart Settings · Reviewed
- MetaQuotes: Volumes · Reviewed