YoForex AI educational guides
MACD indicator explained: signal line, histogram and common mistakes on forex charts
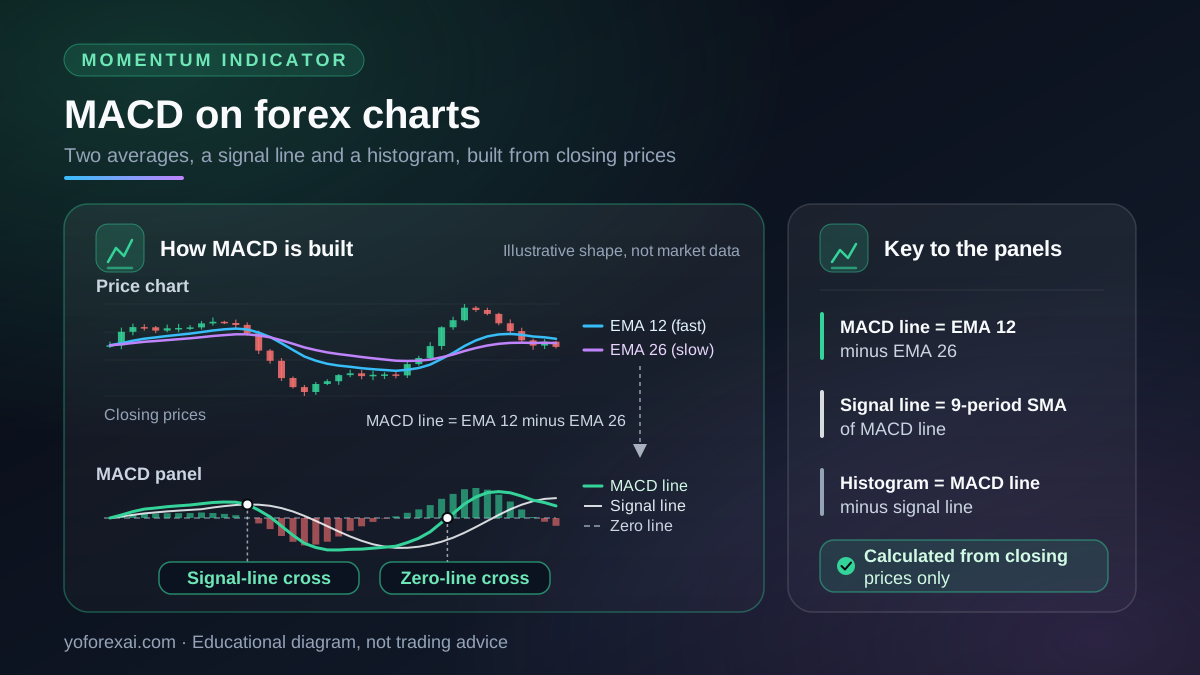
MACD (moving average convergence divergence) is a momentum indicator built from two exponential moving averages of price, 12 and 26 periods by default, plus a 9-period signal line. On forex charts, its line crosses are read as shifts in momentum. It measures the gap between averages, so it describes past price. It does not forecast the next move.
Published · Updated · By YoForex AI Editorial Team
What is the MACD indicator?
The MACD indicator shows how far a shorter average of price has moved away from a longer one, and whether that gap is widening or narrowing. It is an oscillator, so it moves above and below a zero line rather than sitting on the price scale. The version on MetaTrader 5 follows the same method, and the MetaQuotes help page describes it as the difference between a 26-period and a 12-period exponential moving average.
The MetaQuotes MACD help page gives the formula as MACD equals the 12-period EMA of closing prices minus the 26-period EMA of closing prices. The indicator therefore uses closing prices only and does not need volume data. The MQL5 MqlRates structure lists tick volume and trade volume as separate fields.
What are the default MACD settings?
The MetaQuotes formula uses 12 periods for the fast average, 26 for the slow average and 9 for the signal line. These are defaults, not rules about which values work. The table lists each part, the value it starts from and what it is.
If you want the basics of how an exponential average differs from a simple one, read the EMA vs SMA guide first. The MACD section below assumes you know that the EMA gives more weight to recent closes.
| Component | Default | What it is |
|---|---|---|
| Fast EMA | 12 periods | Exponential average of closing prices that reacts more quickly. |
| Slow EMA | 26 periods | Exponential average of closing prices that reacts more slowly. |
| MACD line | Fast EMA minus slow EMA | The gap between the two averages. Above zero, the fast average is higher. |
| Signal line | 9-period simple moving average of the MACD line | A smoothed version of the MACD line. Crosses with it are the most common reading. |
| Histogram | MACD line minus signal line | Bars that show the gap between the two lines. The bars change sign when the lines cross. |
Settings change how quickly the indicator reacts, so any change should be written into your test rules before you look at results. A shorter fast average gives earlier readings and more false crosses. A longer one gives fewer readings and more delay. The test should state the values, the price input (usually the close) and the timeframe.
How do you read a signal-line cross?
A signal-line cross happens when the MACD line moves through the signal line. The MetaQuotes page describes the basic rule as selling when the MACD falls below its signal line, and buying when it rises above it. That is a rule to test, not evidence that it makes money. On a forex chart, a cross is best read as a change in the balance between the fast and slow averages, and it is only as useful as the market context around it.
| Reading | What it shows | What it does not show |
|---|---|---|
| MACD line crosses above the signal line | The fast average is gaining on the slow average. | That the rise will continue, or how far it will go. |
| MACD line crosses below the signal line | The fast average is losing ground to the slow average. | That price will fall, or that an existing move is over. |
| MACD line crosses the zero line | The fast average has moved above or below the slow average. | Whether the change will hold, or whether it came after most of the move. |
| Histogram bars shrink toward zero | The gap between the MACD line and the signal line is narrowing. | Whether a cross is coming, or whether one has already failed. |
Crosses cluster on sideways charts, and each one can look like a signal until the next reverses it. Count the crosses in your test window, including the ones that failed. Do not judge the rule by the few that worked.
The zero-line cross is a more basic change. It means the fast average has moved from below the slow average to above it, or the reverse. Some traders wait for it as confirmation of a signal-line cross. Whether that wait helps is a question to measure on your own data, not something the indicator settles.
Hypothetical example, round numbers, not market data. Suppose the 12-period EMA of a pair reads 1.1050 and the 26-period EMA reads 1.1030. The MACD line is 1.1050 minus 1.1030, which is 0.0020. On a pair quoted to four decimals, that gap is 20 pips. Suppose the 9-period signal line reads 0.0015. The MACD line is above its signal line, and the histogram reads 0.0005, or 5 pips on the same scale. One reading does not show whether that gap is widening or narrowing. Compare it with the previous bars. It does not tell you where price will be next.
How does MACD divergence work on FX pairs?
Divergence means price and the indicator disagree. A common version is price making a higher high while the MACD line makes a lower high. Traders read this as weaker momentum at the new high. On FX pairs, the comparison should run on the same chart and timeframe, and both highs should come from the same kind of swing. Check that the two peaks are real swing points, not a spike that appears only in the indicator.
Divergence can persist while price keeps moving in the same direction. Treat it as a reason to look more closely at the chart, and write down your rule for the second check before you rely on it.
Divergence is a visual judgment. Two traders can mark different swings on the same chart, and an EA cannot read it unless its author codes a rule for finding swing points. If you test a divergence rule, write down exactly how the swings are picked, because that choice decides which divergences the test sees.
What are the common MACD mistakes?
Most problems with MACD come from how it is used, not from the calculation. These are the errors that show up most often when traders review their charts:
- Treating every cross as a trade. A cross is an event on the chart. A trade rule also needs an entry, a stop-loss, an exit and a position size.
- Mixing timeframes. A 15-minute MACD and a daily MACD on the same pair can point in opposite directions at the same moment. State the timeframe in every observation.
- Ignoring the range. In a sideways market, crosses repeat and each one looks like a fresh signal. A rule that works in a trend may cost you repeated small losses in a range.
- Changing settings after a loss. If you move from 12, 26 and 9 to values that happen to fit recent charts, the test measures the fit, not the indicator.
- Using MACD as the only reason. If you need a price level, mark it on the chart separately. Use the MACD reading as one check, not as the full case for a trade.
Where can MACD fit an EA rule or an AI chart read?
An Expert Advisor can use MACD as one of its rules. A simple version opens a long position when the MACD line crosses above its signal line and closes it on the opposite cross. The EA does exactly what its code says, including the parts you may not want. Before you assume it matches the rules on this page, read the inputs and the code. Check which periods, which price input and which bar it uses. The evaluate a forex EA guide explains how to test a rule set like this, and the forex expert advisor guide explains what an EA is.
AI analysis can also describe an indicator on a chart. YoForex AI is our product. It is an AI-assisted chart-analysis dashboard: you provide a chart, and it returns a suggested direction, entry, stop-loss and take-profit levels with the model’s reasoning, for you to review. If the model describes MACD, treat that description as a claim to check against the chart, not as a reading you can act on. The AI forex chart analysis guide sets out that check step by step.
Whether an EA or an AI tool adds value is a question for a test, not a feature list. Record the rule, the period, the trades it produced and the costs, then compare the results with the rule you wrote, not with the best examples you remember.
What can MACD not tell you?
MACD is built from past closes, so it reacts after price has moved. It does not produce a price target, a stop-loss or a probability that a cross will work. It describes the difference between two averages and nothing else. It does not account for news releases, session opens or the spread you pay to enter and exit.
| Question | Can MACD answer it? | Why |
|---|---|---|
| Will price rise next? | No | The lines are calculated from past closing prices. |
| How far will a move go? | No | MACD has no target or measured-move output. |
| Is the momentum gap widening? | Partly | The histogram and the line distance describe momentum, not the cause of it. |
| Should I trade this cross? | No | That depends on your rules, your costs and your test results. |
Risk warning. You can lose more than you deposit, depending on your broker and country. Forex trades made with leverage can lose money quickly, and a cross that worked on past charts can fail on the next one. The rules for retail forex differ between countries. Check what applies to you with your own regulator, and treat any MACD setting as something to test, not something to trust.
Key takeaways
- MACD is the difference between a 12-period and a 26-period EMA of closing prices, with a 9-period signal line by default.
- A signal-line cross shows a change in the balance between two averages. It does not confirm a move.
- Zero-line crosses and histogram changes are readings to test, not rules to trust.
- MACD uses closing prices only, so it does not need volume data. It still lags price.
- Fix the settings, price input and timeframe before you test, and keep them fixed.
Frequently asked questions
Why do the default MACD settings matter?
The MetaQuotes help page gives 12 for the fast EMA, 26 for the slow EMA and 9 for the signal line. Check the values in your platform’s input window whenever you load a chart template or an EA, because a template can carry different settings.
Is MACD a buy and sell indicator?
MetaQuotes describes a basic rule: sell when the MACD falls below its signal line, and buy when it rises above it. That is a rule to test. It is not evidence that the rule works, and the indicator does not choose a direction for you.
Does MACD use volume?
No. The formula uses closing prices only. The MQL5 MqlRates documentation lists tick volume and trade volume as separate fields.
What is the difference between MACD and the MACD histogram?
The MACD line is the fast EMA minus the slow EMA. The histogram is the MACD line minus the signal line. The histogram shows the gap between the two lines, so it changes sign when they cross.
What is the best MACD setting for forex?
No setting is best across all pairs and timeframes. Pick a set of values, write it down, and test it on data you did not use to choose it. Changing values until the results look good is curve fitting, not analysis.
Can an AI tool read MACD for me?
An AI tool can describe what it sees, including an indicator, but its description needs checking on the chart. The AI forex chart analysis guide has the checklist.
Sources and verification
Primary-source links used for the platform behavior and risk statements in this guide. Sources reviewed 9 November 2026.