YoForex AI educational guides
Descending triangle pattern and other triangle chart patterns
A descending triangle pattern is a chart shape with a flat support line along the bottom and a falling upper trendline made of lower highs. Price is said to break down when it closes below the flat support. Triangle chart patterns also include ascending and symmetrical triangles. None is a forecast, and each can fail.
Published · Updated · By YoForex AI Editorial Team
A descending triangle pattern forms when price makes lower highs while it keeps returning to the same flat support level. On a chart, the shape looks like a right triangle with the flat side at the bottom. Traders usually read it as a continuation of a downward move, and they wait for a close below the support before they treat the shape as complete. The same family includes the ascending triangle and the symmetrical triangle, which are read differently.
What is a descending triangle pattern?
A descending triangle has two boundaries. The lower boundary is a horizontal line that price has touched at least twice, which acts as support. The upper boundary is a downward-sloping trendline drawn across the swing highs, which shows that each rally is weaker than the one before. The two lines meet at a point to the right of the pattern, and the shape narrows as price moves toward that point.
Common convention reads the pattern as bearish in its usual form. A close below the flat support is the event that most traders use as the signal. The shape itself does not show how far price will fall. Some practitioners use a common convention: measure the widest part of the triangle and project that distance from the breakout. This is a practitioner convention, not a sourced rule, and it is not a guarantee.
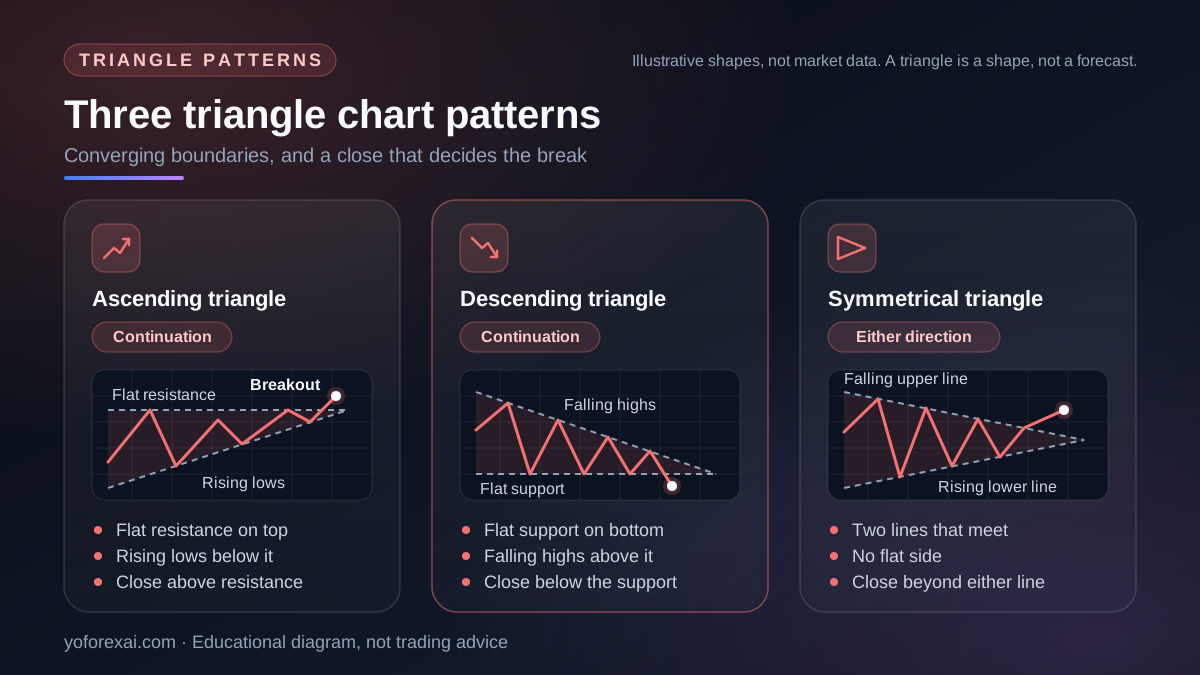
How do ascending, descending and symmetrical triangles differ?
The three triangles share one feature: price is squeezed between two lines that converge. They differ in which boundary is flat and which one slopes. The table compares how each boundary is drawn, how many touches make a line count, and the level that ends the read. The directional reading is a common technical-analysis convention, not a result that any regulator or exchange has verified.
| Pattern | How to draw the boundaries | Touches before a line counts | Invalidation level |
|---|---|---|---|
| Ascending triangle | A flat line across two or more swing highs at one price, and a rising line under two or more swing lows | Two lows on the rising line, and two highs on the flat line. A third touch is a common check, not a rule. | The most recent swing low inside the triangle. A close below the rising line ends the read. |
| Descending triangle | A flat line under two or more swing lows at one price, and a falling line across two or more lower swing highs | Two swing lows on the flat support. Decide whether wicks or closes define the touch, and write the choice down. | The most recent lower high inside the triangle. A close above it means the falling line has broken. |
| Symmetrical triangle | A falling line across two or more swing highs and a rising line under two or more swing lows, so the lines meet | Two touches on each line. If the lines are nearly parallel, the shape is a channel or range. | Both boundaries. Price closing back between the two lines voids the break, and a close through the far line is a separate reading. |
The forex chart patterns guide covers the wider set of 15 patterns and lists these three shapes among them. This page goes deeper on the triangle rules, so it does not repeat that comparison.
The symmetrical triangle has no flat side. Both lines slope toward each other, so the pattern does not favour either direction before the break. Many traders treat it as a pause, and they wait for the break before they assign a direction. Since the symmetrical shape can break either way, it needs a clear rule for which side counts.
How do you draw the boundaries of a triangle?
Triangle boundaries are drawn by hand. MetaQuotes says that, unlike technical indicators, its graphical objects are plotted manually. Its analytical objects help page lists a triangle among its shape tools, and it notes that trend lines are one of the line categories. The drawing is a judgment, so two traders can draw the same chart differently.
- Pick one timeframe, and write it down. A triangle on a 15-minute chart can be noise inside a daily range.
- For a descending triangle, draw the flat support through the lowest points that price has tested at least twice.
- Draw the falling upper line through the swing highs. Use the highs that clearly lead lower, not a single spike.
- Check that the lines converge. If they are nearly parallel, the shape is a channel or a range, not a triangle.
For multi-point objects, the MetaQuotes help page says: "click on a chart to add the starting point, then hold down the mouse button and set the object direction and its second point." Keep the drawing fixed once you set it, and do not redraw the lines after a breakout to make the shape look cleaner.
How do you confirm a descending triangle breakdown?
Use a close, not a touch. A descending triangle can have a wick that dips below the flat support and then closes back above it. If you sell on the wick, you act on a condition that may not last. Choose one rule, such as a close on your chart timeframe, and apply it the same way each time.
The flat support is a zone in practice, not a single price. The support and resistance guide explains how to mark a level as a band and why a band is often more useful than one line.
Check the larger trend first. A descending triangle inside a daily uptrend has less context behind its breakdown than one inside a downtrend. Also check the distance to the next visible support.
How do descending triangles fail?
Most failures are visible on the chart after the fact, and most of them come from the process rather than the shape. These are the common ones:
- A false breakdown. Price closes below the support, then closes back above it within a few candles. Decide before you enter how many candles you will wait before you accept a break.
- A breakout in the other direction. A descending triangle can resolve upward. A close above the upper falling line changes the reading, and a stop placed above the triangle protects against that case.
- Redrawn lines. Moving the support after a loss makes the test measure your memory, not the rule.
- A stop placed by feel. A stop far above the triangle can make the loss larger than the amount you planned to risk.
- An event in the middle of the setup. A scheduled economic release can move price sharply through a level, and a clean-looking triangle can be broken by a single spike.
What triangle patterns cannot tell you
A triangle is a shape, not a forecast. It records where price has touched and how the highs and lows have moved, and it stops there. It does not tell you when the break will come, how big the move will be, or whether the break will hold. Two triangles with the same outline can produce very different results on different pairs and sessions.
Hindsight makes triangles look cleaner than they were. Once the break has happened, it is easy to choose the two lines that fit best and forget the touches that did not. Draw the lines while the pattern is still forming, save a dated screenshot, and judge the setup from that record rather than from the finished chart.
Be careful with any success rate quoted for triangles. A figure means little unless it names the pair, the timeframe, the sample size, and the exact drawing and confirmation rules behind it.
If you ask an AI model to find a triangle, give it the boundary rules from the table above and check the candles it says each line touches; a model can anchor a line on the wrong swing or read a different timeframe from the one you meant. The AI forex chart analysis guide covers how to check a label against the chart before you rely on it.
How should you test a triangle rule before you use it?
Write the rule first: the timeframe, the drawing method, the confirming close, the invalidation level and the position size. Record every triangle as it forms, including the ones you skip, and compare results with the written rule, not with the best examples you remember.
A demo account or paper record shows whether you apply the rule consistently, but it cannot reproduce real fills or spreads. The paper trading guide covers those limits. For a different shape with its own breakout rule, see the cup and handle pattern guide.
Risk warning. You can lose more than you deposit, depending on your broker and country, and forex trades made with leverage can lose money quickly. Triangle breakouts are often fast and can reverse within a few candles, so a stop that is too tight or too wide can cost more than planned. Check the rules that apply to you with your own regulator before you trade any setup. The leverage and margin guide explains how margin changes the loss on a single trade.
Key takeaways
- A descending triangle pattern has a flat support below and falling highs above. It is usually read as bearish if price closes below the support.
- Ascending triangles have a flat resistance above, and symmetrical triangles have no flat side. Symmetrical triangles need a rule for which break counts.
- Draw the lines on one fixed timeframe, and do not redraw them after the break.
- Confirm the breakdown with a close, not a wick, and set the invalidation point before you enter.
- A triangle is a shape, not a forecast. Test the written rule forward before you risk money on it.
Frequently asked questions
What does a descending triangle pattern mean?
It describes price making lower highs while it keeps testing the same flat support. The usual reading is bearish, but only after price closes below that support. Until then, the shape only shows that sellers are gaining ground while buyers defend one level.
Is a descending triangle bullish or bearish?
In its usual form, a descending triangle is read as bearish, because the expected break is downward. The shape can also break upward. The direction is set by the close, not by the outline, so a rule that waits for the close is needed before you assign a bias.
What is the difference between a descending triangle and a symmetrical triangle?
A descending triangle has a flat bottom line and a falling top line. A symmetrical triangle has two lines that slope toward each other, with no flat side. The descending shape carries a directional reading from its flat support, while the symmetrical shape is read only after the break.
How far does a descending triangle breakdown move?
The shape does not say. A common practitioner convention is to measure the widest part of the triangle and project that distance below the support. It is not a sourced rule, and price can stop well before the projected level or run past it.
Can I use a triangle pattern on any forex pair?
The shape can be drawn on any pair or metal chart, but results depend on the pair, session and timeframe. Each market needs its own forward test.
Sources and verification
Primary-source links used for the platform behavior and risk statements in this guide. Sources reviewed 9 November 2026.
- MetaQuotes: Analytical Objects · Reviewed
- MetaQuotes: Object Types · Reviewed