YoForex AI educational guides
Traders Dynamic Index (TDI): Definition and Components
The traders dynamic index (TDI) is a community-developed technical indicator. It combines RSI-based lines, volatility bands and a base line in one panel below the price chart. Implementations differ between scripts, so read each script’s inputs before you use its readings.
Published · Updated · By YoForex AI Editorial Team
What is the traders dynamic index?
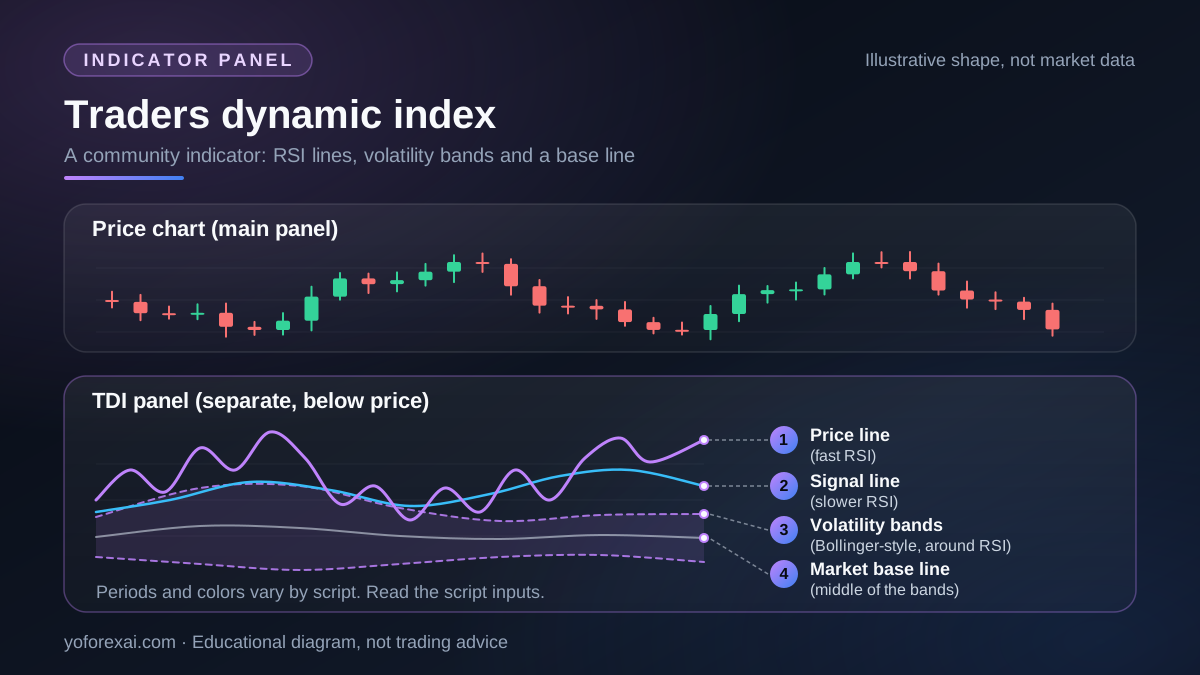
The traders dynamic index is a technical indicator that places several RSI-based lines in a separate panel under the price chart. It is shortened to TDI. Community descriptions of TDI usually list a fast line, a slower signal line, a set of volatility bands and a base line; no official source defines these parts. Together they are meant to show how momentum and volatility change over time. TDI is a community indicator. The scripts that implement it are written by different authors, and implementations vary, so a script may draw these parts differently or add others.
The MetaQuotes oscillators help index, checked on 9 November 2026, lists 15 oscillators. TDI is not in that list of built-in oscillators. We did not find a TDI page in the MetaQuotes indexes we checked. Community-written TDI scripts for MetaTrader 5 may exist, and this page does not treat any one of them as the standard. If you already read the MACD guide or the relative vigor index guide, note that TDI is a different construction with its own inputs.
What are the TDI components?
Community TDI scripts usually describe four parts. The table lists each part and what it is meant to show. Implementations vary, so labels and default values differ between scripts. Check the labels and inputs of the script you have loaded.
| Component | What it is | What it is meant to show |
|---|---|---|
| Price line | A fast-moving line calculated from the RSI. | Short-term changes in RSI momentum. |
| Signal line | A slower smoothing of the RSI, drawn alongside the price line. | A reference line for crosses with the price line. |
| Volatility bands | Bollinger-style bands drawn around the RSI line. | How widely the RSI is moving, and whether it is contracting. |
| Market base line | The middle line of the volatility bands. | A reference level that some readers use for trend. |
How does RSI work inside the TDI?
The relative strength index (RSI) is the raw input to a TDI. The MetaQuotes RSI help page gives its formula as RSI = 100 - (100 / (1 + U / D)), where U is the average of positive price changes and D is the average of negative price changes over the chosen period. The same help page says Wilder recommended a 14-period setting, and that 9-period and 25-period versions are also popular. RSI is bounded between 0 and 100. The MetaQuotes RSI help page says RSI usually tops above 70 and bottoms below 30.
Community TDI scripts usually describe the price line and signal line as smoothed copies of that RSI. Implementations vary. Smoothing adds lag, so the TDI lines react later than the RSI does. A reading is therefore a summary of recent bars, and it is available only after those bars have closed. Check the TDI against the candles on the main chart before you rely on it.
How are the volatility bands calculated?
Community TDI scripts usually describe bands drawn around the RSI line with the Bollinger method. Implementations vary. The MetaQuotes Bollinger Bands help page defines the bands on price this way: the middle line is a simple moving average of closing prices over N periods, and the upper and lower lines sit D times the standard deviation of those prices above and below it. The help page recommends a 20-period simple moving average as the middle line. It describes standard deviation as “a measure of volatility”, so the bands widen when volatility rises and contract when it falls.
Band width is therefore a reading in its own right. A narrow band means the RSI has moved little recently. The MetaQuotes Bollinger Bands page says abrupt changes in prices tend to happen after the band has contracted. That is an observation about past behavior. It is not a rule that a breakout will follow.
How do traders read the lines?
Readings described for TDI scripts include a cross between the price line and the signal line, the position of the price line relative to the base line, and the width of the bands. Each reading needs a written definition before you use it. Decide which cross counts, on which timeframe, and whether a cross must happen above or below the base line to count.
- A cross is an event on the chart. Several crosses can occur in a short run during a sideways market.
- An RSI above the upper level can be read as overbought, the same as with plain RSI. That describes the state of the indicator. It does not tell you the next move in price.
- A narrow band can precede a larger move, but the direction is not given by the band itself.
Why do TDI versions look different?
The inputs that can differ between TDI scripts are the RSI period, the smoothing lengths of the price and signal lines, and the length and deviation of the bands. Some scripts also change the overbought and oversold levels, the base-line period, or the colors. Two scripts can both be called TDI and still show different values on the same chart. If you copy a published setting without reading its inputs, you may misread the panel you are looking at.
The same applies to AI chart tools. If a tool reads a TDI from a screenshot, ask it which inputs it assumed, and check that the lines match the script on your own platform. The AI forex chart analysis guide explains how to check model output against the chart.
What can the TDI not tell you?
A TDI describes recent RSI momentum and volatility on one chart. It does not forecast where price will go, and it does not tell you when a trade will work. Every line is calculated from past prices, so each reading is known only after the bars behind it have formed. That is true of all oscillators.
- It does not set a stop, a target or a position size. Bands and base lines are reference levels, not price forecasts.
- It does not account for news releases, spread widening or session changes. A reading during a scheduled release can change because price moves, not because the indicator has an edge.
- It does not test itself. A cross that looks clear on past bars can fail on new data, so a TDI rule needs its own test.
- Adding inputs or lines does not add information. A panel can look more complete while showing the same underlying RSI.
How should you test a TDI rule?
Write the rule before you look at results. Record the script name and its inputs, the timeframe, the exact cross or band condition, the stop, and the position size. Then test the rule on history in the Strategy Tester, and forward test it on a demo account. The Expert Advisor evaluation guide covers the testing steps in more detail. Keep a record of every signal, including the ones you did not take.
Risk warning. Forex can be traded with leverage. You can lose more than you deposit, depending on your broker and country. An indicator does not reduce that risk, and a TDI setup that looks clear on a chart can still lose money. Check the rules for leveraged products that apply to you with your own regulator. The forex risk control guide covers position sizing and loss limits.
Key takeaways
- The traders dynamic index is a community indicator built from RSI lines and Bollinger-style bands. The MetaQuotes pages we checked do not define a TDI version.
- The RSI formula and the 14-period setting come from the MetaQuotes RSI help page. TDI periods can differ from script to script.
- Community TDI scripts usually build the bands with the Bollinger method; check the code of the script you load.
- Read the inputs of each script before you use its crosses, levels or colors.
- A TDI describes past RSI momentum and volatility. It does not forecast price, and any rule based on it needs a forward test.
Frequently asked questions
What does TDI stand for in trading?
TDI stands for traders dynamic index. It is a technical indicator that shows RSI-based lines and volatility bands in a panel below the price chart. Some traders use the abbreviation for the same indicator, but versions differ, so confirm what the script on your chart plots.
Is the traders dynamic index built into MetaTrader 5?
TDI is not in the MetaQuotes list of built-in oscillators, which lists 15 oscillators and was checked on 9 November 2026. That list does not cover every MetaTrader 5 indicator category, so check your own platform's indicator list. Some community-written scripts implement TDI. Read the code or the inputs of any script before you install it, and treat its output the same way you would treat any indicator you have not tested.
What are the default settings for TDI?
There is no single default. The MetaQuotes Bollinger Bands page recommends a 20-period simple moving average and two standard deviations. The MetaQuotes RSI page gives the 14-period recommendation attributed to Wilder, and does not present it as a default. Neither page describes TDI settings. Read the inputs of the script you use, and write them down with your rule so that the test can be repeated.
Is TDI the same as RSI?
No. RSI is one input to the TDI. The TDI adds smoothed lines, volatility bands and a base line around the RSI. Its readings are therefore affected by the RSI period, the smoothing lengths and the band settings, so the same RSI value can appear differently in two TDI panels.
Can TDI tell me when to buy or sell?
No indicator can guarantee a buy or sell signal. A cross or band condition is a rule you define in advance and then test. It describes a state of the chart. It does not tell you how the trade will end.
Sources and verification
Primary-source links used for the platform behavior and risk statements in this guide. Sources reviewed 9 November 2026.
- MetaQuotes: Relative Strength Index · Reviewed
- MetaQuotes: Bollinger Bands · Reviewed