YoForex AI educational guides
Relative vigor index (RVI): formula, worked example and limits
The relative vigor index (RVI) is an oscillator that divides a weighted sum of recent (close minus open) values by a weighted sum of (high minus low) ranges. Because each bar’s body is no larger than its range, the value stays between -1 and 1. Read it as a measure of closing strength, not as a forecast.
Published · Updated · By YoForex AI Editorial Team
The relative vigor index is a momentum oscillator. It compares how far each bar closed from its open with how far the bar travelled from low to high, then smooths the result over four bars. Traders use it as a definition of recent closing strength, and as one input to a rule they write and test. This guide explains the formula, shows a hypothetical calculation with labelled numbers, and sets out what the RVI cannot tell you.
What is the relative vigor index?
The idea behind the RVI is simple. In a strong up move, bars tend to open low and close well above the open, often near their highs. In a weak move, bars tend to open high and close below the open. The RVI turns that observation into a number. It takes the body of each bar, meaning the distance between open and close, and compares it with the full range of the bar, meaning the distance from high to low.
A single bar can be misleading, so the index uses the last four bars with weights. Values near +1 mean recent bars closed well above their opens relative to their ranges. Values near -1 mean they closed well below. Values near zero mean the bodies were small or balanced against each other. The RVI describes the bars that have already formed. It does not show where the next bar will close.
How is the RVI calculated?
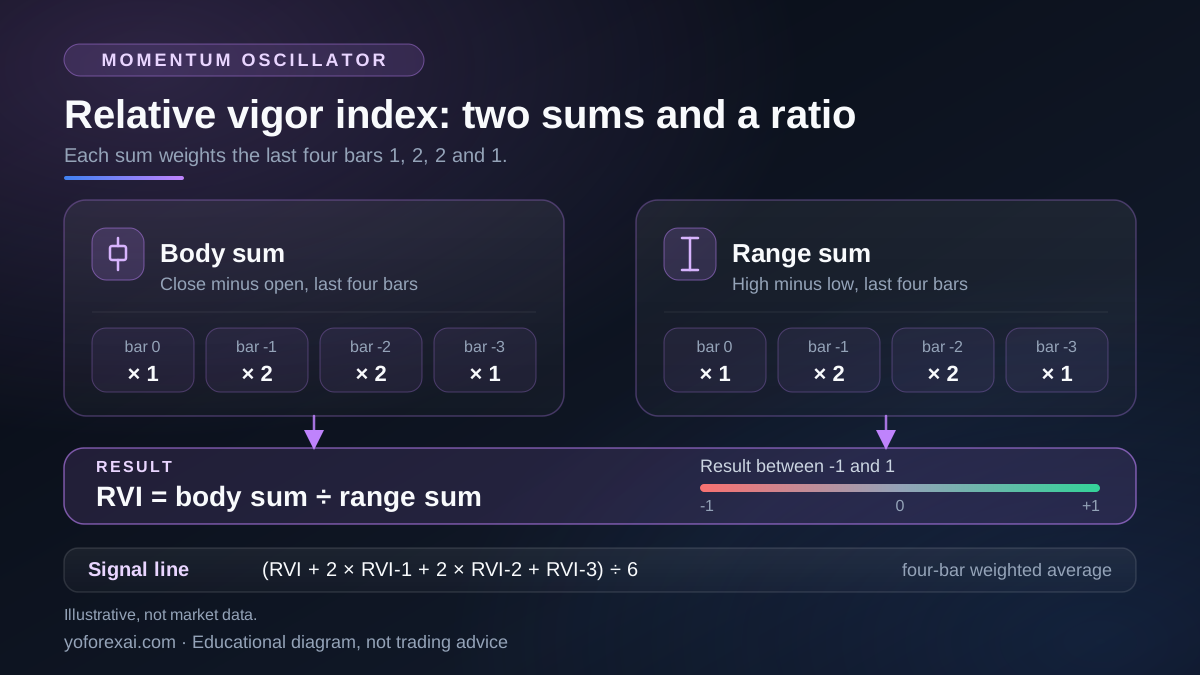
The MetaQuotes help page for the Relative Vigor Index builds the index from two weighted sums. The first sums the body of each bar, close minus open. The second sums the range of each bar, high minus low. Both sums use the four most recent bars, and the weights run 1, 2, 2 and 1. The two middle bars count twice as much as the outer two. The index is the body sum divided by the range sum.
| Part | What it adds up | Weights on bars 0, -1, -2, -3 |
|---|---|---|
| Body sum (numerator) | Close minus open for each bar | 1, 2, 2, 1 |
| Range sum (denominator) | High minus low for each bar | 1, 2, 2, 1 |
| RVI | Body sum divided by range sum | Result is between -1 and 1 |
Bar 0 is the most recent bar, and bar -3 is the oldest of the four. The MetaQuotes page defines both sums as four-bar weighted sums with weights 1, 2, 2 and 1, and gives the RVI as the ratio of the two. Because both sums use the same positive weights and each body is no larger in size than its range, the body sum cannot exceed the range sum in size, so the value stays between -1 and 1. The ratio is undefined when the range sum is zero, so check how your platform handles flat data.
What does the signal line add?
The RVI is usually drawn with a signal line. The MetaQuotes help page describes the signal line as a four-bar, symmetrically weighted moving average of RVI values. Its formula is the current RVI plus twice the previous RVI, plus twice the RVI two bars back, plus the RVI three bars back, all divided by 6. The help page also names 10 as the period it considers best. That is an opinion in the help text, not a tested setting for any market, so test the period you choose on data you did not use to pick it.
For custom tools, the MQL5 reference for the iRVI function returns the main line in buffer 0 and the signal line in buffer 1. Its input is the averaging period, passed as ma_period. The reference does not describe the calculation, so use the MetaQuotes page for the formula and the MQL5 page for how to read the buffers.
How do the numbers work in a hypothetical example?
Hypothetical example. The four bars below use invented round numbers. They are not from any chart or broker feed. The point is to show the arithmetic, so you can check your own calculation against it.
| Bar (weight) | Open, high, low, close | Body (close minus open) | Range (high minus low) |
|---|---|---|---|
| Bar -3 (weight 1) | O 1.1000, H 1.1040, L 1.0980, C 1.1030 | 0.0030 | 0.0060 |
| Bar -2 (weight 2) | O 1.1030, H 1.1070, L 1.1010, C 1.1060 | 0.0030 | 0.0060 |
| Bar -1 (weight 2) | O 1.1060, H 1.1090, L 1.1040, C 1.1050 | -0.0010 | 0.0050 |
| Bar 0 (weight 1) | O 1.1050, H 1.1100, L 1.1040, C 1.1090 | 0.0040 | 0.0060 |
The body sum is 1 × 0.0030 + 2 × 0.0030 + 2 × (-0.0010) + 1 × 0.0040, which equals 0.0110. The range sum is 1 × 0.0060 + 2 × 0.0060 + 2 × 0.0050 + 1 × 0.0060, which equals 0.0340. The RVI is 0.0110 divided by 0.0340, about 0.32. In this example the latest bar closed higher than it opened, but the second-latest bar closed lower, and that pulls the sum down. A reader who looks only at the last candle would miss that. The signal line would need the RVI for the current bar and for the three bars before it, so it is not calculated here.
How do traders read RVI on a chart?
Most written rules use three observations. The first is whether the RVI sits above or below zero. The second is whether the RVI line crosses its signal line. The third is whether price and the index disagree, which is usually called divergence. The MetaQuotes page says that the concurrence of the two lines serves as a signal to buy or to sell, but it does not say which direction means which action. Any rule you write must name the direction, the bar that confirms the cross, and the exit.
| Observation | What it describes | What it does not show |
|---|---|---|
| RVI above zero | Recent bodies lean up relative to their ranges | That the next bar will close higher |
| RVI below zero | Recent bodies lean down relative to their ranges | That a reversal has started |
| RVI crosses its signal line | The index and its smoothed line have changed order | That acting on the cross will be profitable |
| Price and RVI disagree | Price makes a new high while the RVI does not | That price will turn, or when |
A crossover on a chart is easy to see after the fact. Before you act on one, decide whether you will wait for the crossing bar to close, and whether a second check, such as a level on a higher timeframe, must agree. The chart patterns guide uses the same close-based confirmation logic, and it is a useful model for writing these rules.
Where does the RVI fit with other tools?
The RVI overlaps with other oscillators, because they all try to describe momentum over a short window. It is calculated differently from the MACD indicator. The traders dynamic index is a composite panel with its own components. When you test a rule, use one oscillator at a time, so you can tell which input changed a result.
If you read charts with an AI tool, ask it which indicators it used and what values it read, then check those values against your own chart. YoForex AI is our product. It returns a suggested direction, entry, stop-loss and take-profit levels, with its reasoning, for you to review. Confirm any indicator value yourself before you rely on it. The AI forex chart analysis guide lists the checks to run.
What the relative vigor index cannot tell you
The RVI describes the last few bars. It does not forecast price, it does not give a target, and it does not say how large a move will be. Because the index is built from bars that have already closed, any signal it gives comes after the bars that form it. The limits below apply to every use of the index.
- Four bars of memory. A single large bar can move the index sharply, and a quiet market can keep it near zero for long periods.
- Price only. The RVI uses open, high, low and close. It says nothing about volume, spreads, news, or the cause of a move.
- Feed dependence. Bars come from your broker’s price feed, so compare the OHLC values on your own chart before you rely on the index.
- Parameter sensitivity. The period you choose changes the output. A test of one period is not a test of the idea.
- Flat data. When the range sum is zero, the ratio cannot be calculated, so a platform may show an empty or misleading value.
Risk. You can lose more than you deposit, depending on your broker and country. Any oscillator, including the RVI, can give a reading that looks clear and is followed by a loss. Forex trades can be made with leverage, which can magnify losses. A rule that looked good on past bars does not show what fills, spreads and swap charges would have done. If you turn an RVI rule into an expert advisor, the evaluate forex EA guide lists what to check, and the paper trading guide explains why a demo record has its own limits. Check the rules that apply to you with your own regulator.
Key takeaways
- The RVI divides a four-bar weighted sum of close minus open by a four-bar weighted sum of high minus low, so it stays between -1 and 1.
- The signal line is a four-bar weighted average of RVI values, weighted 1, 2, 2 and 1.
- Use the hypothetical example to check your own arithmetic, not to judge a live chart.
- A crossover is only a rule once you name its direction, its confirmation bar and its exit.
- The RVI uses price only. It cannot show volume, spreads, news or the cause of a move.
Frequently asked questions
What does the relative vigor index tell you?
It tells you how the recent bars have closed relative to their opens and ranges. Values above zero mean the recent bodies lean up, and values below zero mean they lean down. It is a description of the last few bars, not a forecast.
Is an RVI crossover a buy or sell signal?
Not by itself. The MetaQuotes help page says the concurrence of the two lines serves as a signal to buy or to sell, but a trade rule also needs a direction, a confirmation bar, a stop and an exit. Without those, a crossover is only an observation.
What period should I use for the RVI?
No period is proven best for forex. The MetaQuotes help page names 10 as the period it considers best, which is an opinion in the help text. Choose a period in advance, test it on data you did not use to choose it, and record the result for each change you make.
Is the RVI the same as the RSI?
No. The MetaQuotes RSI help page describes the relative strength index as built from average positive and negative price changes. The RVI is built from each bar’s open, high, low and close, comparing the body with the range. The two can disagree on the same chart because they measure different things.
Can I see the RVI in MetaTrader 5 without writing code?
Check your own terminal’s indicator list, because menus can differ between builds. If you need the values in a custom program, the MQL5 iRVI function returns the main line and the signal line. The function is documented, but its calculation is not described on that page, so use the MetaQuotes help page for the formula.
Sources and verification
Primary-source links used for the platform behavior and risk statements in this guide. Sources reviewed 9 November 2026.
- MetaQuotes: Relative Strength Index · Reviewed
- MetaQuotes: Relative Vigor Index · Reviewed
- MetaQuotes: iRVI · Reviewed