YoForex AI educational guides
Bearish engulfing pattern: bullish and bearish rules, context and limits
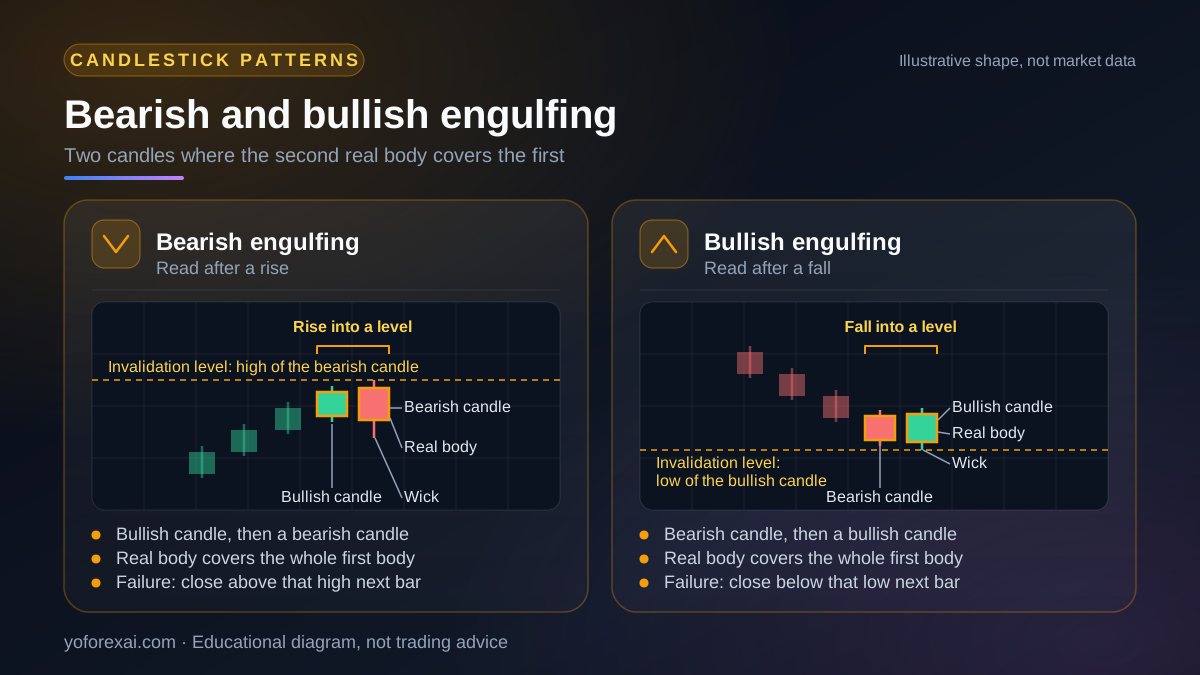
A bearish engulfing pattern is a two-candle chart shape, as commonly defined. A bullish candle is followed by a bearish candle whose real body fully covers the body of the first candle, and the shape is read after a rise. The bullish version is its mirror image after a fall. It describes one relationship between two bars, not a forecast.
Published · Updated · By YoForex AI Editorial Team
What is a bearish engulfing pattern?
A bearish engulfing pattern is a two-candle reversal shape that can appear after a rise in price. The first candle is bullish, meaning its close is above its open. The second candle is bearish, and its real body covers the whole body of the first candle. The real body is the part between the open and the close. The thin lines above and below it are the wicks, or shadows. This guide names the shape by the full cover of the body, not by the wicks.
Some traders read the pattern as a sign that sellers pushed back hard after buyers had been in control. That reading describes what the candles show. It does not say what price will do next. A bearish engulfing candle that forms in the middle of a sideways range tells you much less than the same candle at the end of a sustained rise.
The bullish engulfing pattern is the mirror image. A bearish candle is followed by a bullish candle whose body covers it, and the shape is read after a fall. Both versions use the same logic, so the rules below are written once and applied in both directions.
Bullish and bearish engulfing rules
Use the table as a checklist. The candle rule is the common version used in this guide, not an official definition. The context column describes what makes the shape worth a second look. The failure column names an observation that tells you the pattern did not behave as read.
| Pattern | Candle rule | Context needed | Failure example |
|---|---|---|---|
| Bearish engulfing | A bullish candle, then a bearish candle whose real body covers the whole body of the first. | A rise into a level you can name, such as a prior high or a resistance zone, or after several higher highs. | A close back above the high of the bearish candle on the next bar. |
| Bullish engulfing | A bearish candle, then a bullish candle whose real body covers the whole body of the first. | A fall into a level you can name, such as a prior low or a support zone, or after several lower lows. | A close back below the low of the bullish candle on the next bar. |
Written rules for this pattern differ from one source to another, and no official MetaTrader or MQL5 source defines it. Some rule sets also require the bearish second candle to open at or above the first candle’s close and close at or below the first candle’s open. Others compare only the real bodies, as the table does, and some include the gap between the two opens and closes. Pick one version, state it before you start counting, and apply it the same way on every chart. A bearish candle that closes only a little below the prior close is a weaker match under the stricter version.
Why does context decide whether the pattern matters?
The same two candles can mean different things in different places. A bearish engulfing pattern that forms at the top of a steady climb, against a level where price has stalled before, is a more specific observation than one that forms in the middle of a choppy range. Context does not make the pattern reliable. It limits which candles deserve your time.
Check at least two things before you use the shape. First, the trend on a higher timeframe than your chart. Second, whether the engulfing candle formed at a level you can name, such as a prior high, a horizontal zone or a trendline. The support and resistance guide explains how to mark those levels as zones rather than single lines. A candle that engulfs for no clear reason is only noise until you can point to what it is reacting to.
Volume adds little here. Spot forex has no single central exchange volume, and MetaTrader charts show tick volume. The MQL5 documentation for the iVolume function says it returns the tick volume of a bar, but the page does not explain how the figure is counted. Do not treat a large tick-volume bar as proof that large traders were involved. Treat it as a rough activity measure at most.
How do you check an engulfing candle on an MT5 chart?
MetaTrader 5 can draw prices as bars, Japanese candlesticks or a broken line. The MetaQuotes chart help page says price charts can be presented as a sequence of bars, Japanese candlesticks, and as a broken line. Candlesticks are the usual choice for this pattern, because the body of each bar is easy to compare with the next. The same page says the terminal offers 21 timeframes, from one minute to one month. Choose the timeframe before you look for the shape, and write it down with the observation.
- Set the chart to candlesticks and to the timeframe you plan to test.
- Mark the trend on a higher timeframe, and note whether it is rising, falling or flat.
- Find the two candles and compare the real bodies only. For the body test, ignore the wicks.
- Note the level the pattern formed at, if there is one, and mark it as a zone.
- Write the invalidation level before the next bar closes, and do not move it after the bar has formed.
Hypothetical example. On a made-up pair, the first candle opens at 1.1000 and closes at 1.1040, so it is bullish. The next candle opens at 1.1050, above that close, and closes at 1.0980, below the first open. Its real body covers the whole first body, so the candle rule is met. The invalidation level set in advance is the high of the bearish candle, 1.1055. The next candle closes at 1.1060, above that level, so the observation is recorded as failed. The example shows the process. It does not show what would have happened after that.
What does a failed engulfing signal look like?
Most mistakes with this pattern come from the process, not from the candle shape. The following cases appear often when traders review their own charts:
- Partial cover. The second candle covers only part of the first body, and the trader counts it anyway.
- No level nearby. The shape forms in the middle of a range, and no level or trend supports it.
- A close back through the candle. The next bar closes beyond the invalidation level, which is the failure signal in the table.
- Mixed timeframes. The shape is judged on a one-minute chart while the trend is set on a daily chart.
- Changing the rule after a result. The body test is loosened after a losing trade, so the record no longer measures the rule.
What an engulfing candle cannot tell you
An engulfing candle is one observation on one timeframe. It does not tell you the size of the next move, how long a move will last, or whether price will reach a target. It also does not show what large participants are doing. The chart shows prices that were traded or quoted, not the orders behind them. Two candles can look identical and still come from very different order flow.
Historical examples are weak evidence for a shape like this. Many engulfing candles look clear once the next move is known. Test the rule forward on a demo or paper record, and log the cases you did not trade as well as the ones you did. The paper trading guide explains what a demo test can and cannot show.
Engulfing candles also appear inside every trend. A bearish engulfing candle inside a rise may mark a pause, not a top. Read the trend, the level and the invalidation rule together, and accept that the pattern will be wrong on some bars. The chart patterns guide covers the same limit for larger shapes, and the chart types guide explains why the candlestick view is the one to use for this check.
Risk warning. You can lose more than you deposit, depending on your broker and country. Leveraged forex trades can lose money quickly, and a stop-loss order may not fill at the stop price. A candlestick pattern is not a risk control. Read the leverage and margin guide before you size any trade, and check the rules that apply to you with your own regulator.
Key takeaways
- A bearish engulfing pattern is a bullish candle followed by a bearish candle whose real body covers the first body. It is read after a rise.
- The bullish version is the mirror image after a fall. Use one written rule set for both.
- Context, meaning the trend, the level and the timeframe, matters more than the candle shape alone.
- Set the invalidation level before the next bar closes, and keep that rule fixed.
- An engulfing candle describes one bar relationship. It is not a forecast, and it can fail on any bar.
Frequently asked questions
What is the difference between a bullish and a bearish engulfing pattern?
The shape is the same, but the order of the candles and the trend context are reversed. A bearish engulfing pattern is a bullish candle followed by a larger bearish candle, read after a rise. A bullish engulfing pattern is a bearish candle followed by a larger bullish candle, read after a fall.
Is a bearish engulfing pattern a sell signal?
No single candle is a sell signal by itself. The pattern describes a change in the balance of the last two bars. A trader who uses it still needs written rules for entry, stop level and position size, and those rules are separate from the candle shape.
Do the wicks have to be covered too?
The usual rule in this guide compares real bodies, not wicks. Some traders also compare the full range from high to low. Whichever test you use, state it before you start, and apply it the same way on every chart.
Does the engulfing pattern work on every timeframe?
The shape can form on any timeframe, but its meaning changes with the timeframe. A pattern on a one-minute chart can be noise inside a daily move. Test each timeframe you use as a separate rule set.
Can AI find engulfing candles for me?
An AI model can describe the candles in a chart you show it, but it can miscount or use the wrong timeframe. Ask it to list the candles it used, then check each one against the chart. The AI forex chart analysis guide has a checklist for that step.
Sources and verification
Primary-source links used for the platform behavior and risk statements in this guide. Sources reviewed 9 November 2026.
- MetaQuotes: View and Configure Charts · Reviewed
- MetaQuotes: iVolume · Reviewed