YoForex AI educational guides
Forex line charts, bar charts and candlestick charts compared
A forex chart type is the format that draws price history. MetaTrader 5 offers bars, Japanese candlesticks and a broken line. Bars and candlesticks each show one timeframe interval and its price range. A line shows the sequence of prices with less detail per period. For AI chart review, candlesticks with a visible scale are a practical input.
Published · Updated · By YoForex AI Editorial Team
Line charts forex traders use: what is a line chart?
Forex line charts join a series of price points in order with a single line. Of the three presentations that MetaTrader 5 offers, the line is the least detailed. The platform's chart help describes its price presentations as a sequence of bars, Japanese candlesticks, and a broken line. A line chart gives you the shape and direction of price over time, which is useful for a quick view of the broad path.
The line does not show how far price moved inside each period. A period with a wide high and low can produce the same kind of point on the line as a period with a narrow range. If you need the range, use a bar or candlestick chart instead.
MetaQuotes does not state which price a line point uses. Its MetaTrader 5 chart help page says that bid prices are used for constructing charts, and it does not say how that applies to the line. Check the chart properties in your own platform before you compare a line with a price quoted somewhere else.
What do bar and candlestick charts show?
Bar and candlestick charts both draw one element for each timeframe interval, so each element carries the price range inside that period. The same MetaQuotes page notes that the timeframe is the time of one bar or candlestick, and that the platform offers 21 chart timeframes from one minute to one month. A timeframe is therefore part of every reading you take from either chart.
A bar shows the high and low of a period as a vertical line, with small ticks for the open and close. A Japanese candlestick draws the same four values as a body and wicks. The body spans the open and close, and the wicks reach the high and low. How a platform colors each body is a chart setting, so read your platform's chart properties before you rely on it.
Candlesticks and bars carry similar information in different shapes. The filled body of a candlestick can make the direction of each period easier to scan on a dense screen.
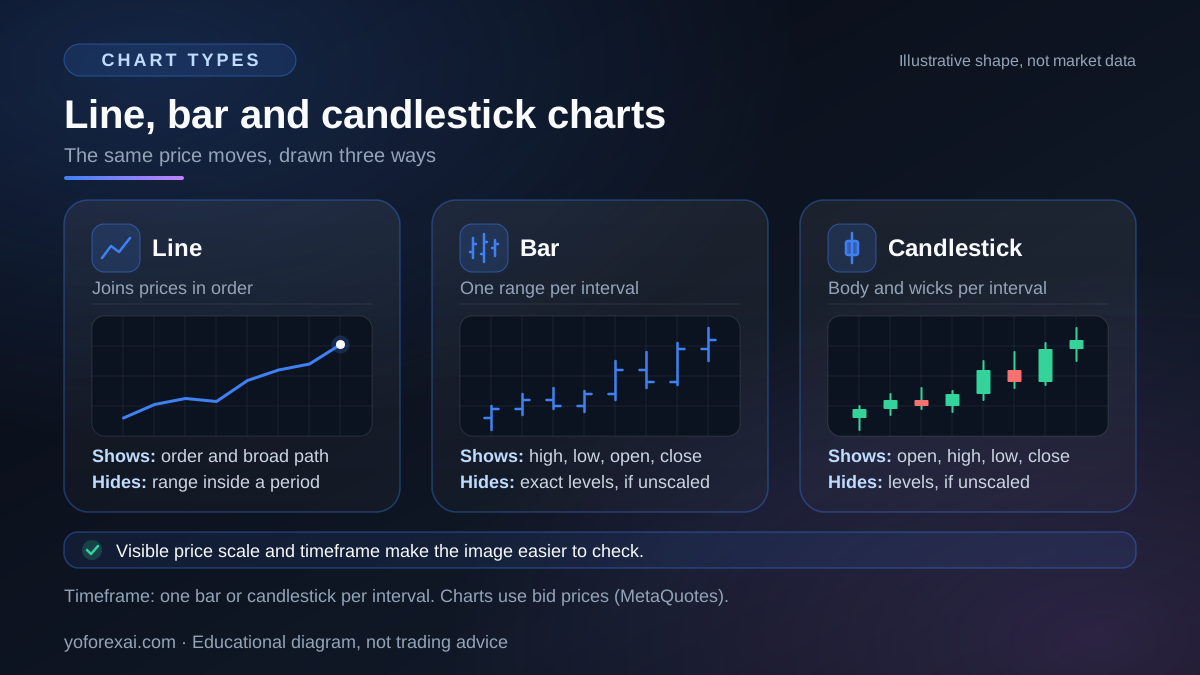
Which chart type shows what, and what does each hide?
Use this table to match a chart type to the question you are asking. Each row names what the drawing shows and what it hides, so you can see the trade-off before you choose.
| Chart type | What it shows | What it hides | Best used for |
|---|---|---|---|
| Line | The order of prices and the broad path over time. | The range inside each period. | A quick view of direction and trend. |
| Bar | The high, low, open and close of each interval. | Exact open and close levels without a visible price scale. | Reading exact ranges on a detailed chart. |
| Candlestick | The same four values as a body and wicks, with direction shown by color. | Exact levels unless a price scale is visible. Colors depend on settings. | Reading each period's shape, and giving an AI tool a clear input. |
The timeframe changes the meaning of every row. A candlestick on a one-minute chart and one on a daily chart can have the same shape and very different context. Write the timeframe, the chart type, and the capture time with every observation.
Which chart type works best for an AI screenshot tool?
For an AI chart review, this guide recommends a candlestick chart with a visible price scale and timeframe. Each period's open, high, low and close appear as one element, so the model has a clear shape to describe. The scale gives it numbers to refer to, and the timeframe tells it which period the candles represent. A line can show a trend, but it gives the model fewer details to check its claims against.
The AI forex chart analysis guide lists what should stay visible in the image: the symbol, the timeframe, the price scale, recent candles and the capture time. Crop out account details and order windows before you share the screenshot.
YoForex AI (our product) is an AI-assisted chart-analysis dashboard. You provide a chart, and it returns a suggested direction, entry, stop-loss and take-profit levels with the model's reasoning, for you to review. The chart type does not change that review step. Check every level against your own platform before you record it as a test hypothesis.
What can a chart type not tell you?
A chart type changes how price is drawn. It does not show the future, your fill price, or the spread you would pay. Three limits apply to every type.
- Bid-based drawing. MetaQuotes states that bid prices are used for constructing charts. Where market depth is available for a symbol, it says the chart is based on Last prices instead. Neither price is the price at which your own order would be filled.
- An unstated line price. The help page does not say which price a line point uses. Do not assume a line matches a candle close exactly.
- Selected views. The FCA guidance on price graphs notes that the timeframe or data shown "may be selected to support a particular viewpoint rather than provide the full picture." Show the timeframe you used and the range around it.
The same FCA guidance says that past performance is not a reliable indicator of future results. A clear candlestick chart does not make a setup more likely to work. A pattern, a level, or a line drawn on any chart type still needs a written rule and a forward test. The forex chart patterns guide sets out the same caution for shapes.
Risk warning. You can lose more than you deposit, depending on your broker and country. Forex trades are often made with leverage, which magnifies losses as well as gains, so a position can move against you faster than the chart suggests. Check the rules that apply to you with your own regulator or local authority, and read the forex leverage and margin guide before you size any position.
Key takeaways
- Forex line charts show the order of prices and the broad direction. They hide the range inside each period.
- Bars and candlesticks show each interval's range, so the timeframe is part of every reading.
- This guide recommends candlesticks with a visible price scale and timeframe as the input for an AI screenshot tool.
- Confirm line values and color settings in your own platform, because the help page does not state every detail.
- Test any chart-reading rule on a demo or paper record before you trade it. The paper trading guide explains the limits of that test.
Frequently asked questions
Which chart type is best for forex beginners?
No chart type is best for everyone. Candlesticks show each period's range, and a line shows the broad path, so a test can use either. Whichever you choose, use it the same way across the whole test.
Does a forex line chart show closing prices?
Not necessarily. The MetaTrader 5 help page does not say which price a line point uses, so check the chart settings in your platform before you assume the point is a close.
Why do candlestick colors look different on other platforms?
Colors are a chart setting, not a universal rule. Two platforms can use different colors for rising and falling periods, and a user can change them. Read the chart properties before you interpret color.
Does the chart type matter more than the timeframe?
Neither matters on its own. The same candle shape means something different on a one-minute chart and on a daily chart. Write the timeframe with every observation, and mark any levels on that same timeframe.
Can a chart type show whether a breakout will hold?
No. A chart type shows the data in a different format. Whether a breakout holds depends on the rules you set and the results you record. The forex chart patterns guide explains a close-based confirmation rule you can test.
Sources and verification
Primary-source links used for the platform behavior and risk statements in this guide. Sources reviewed 9 November 2026.
- UK Financial Conduct Authority: Understanding price graphs · Reviewed
- MetaQuotes: View and Configure Charts · Reviewed