YoForex AI educational guides
Renko chart: brick rules, MT5 status and what the chart hides
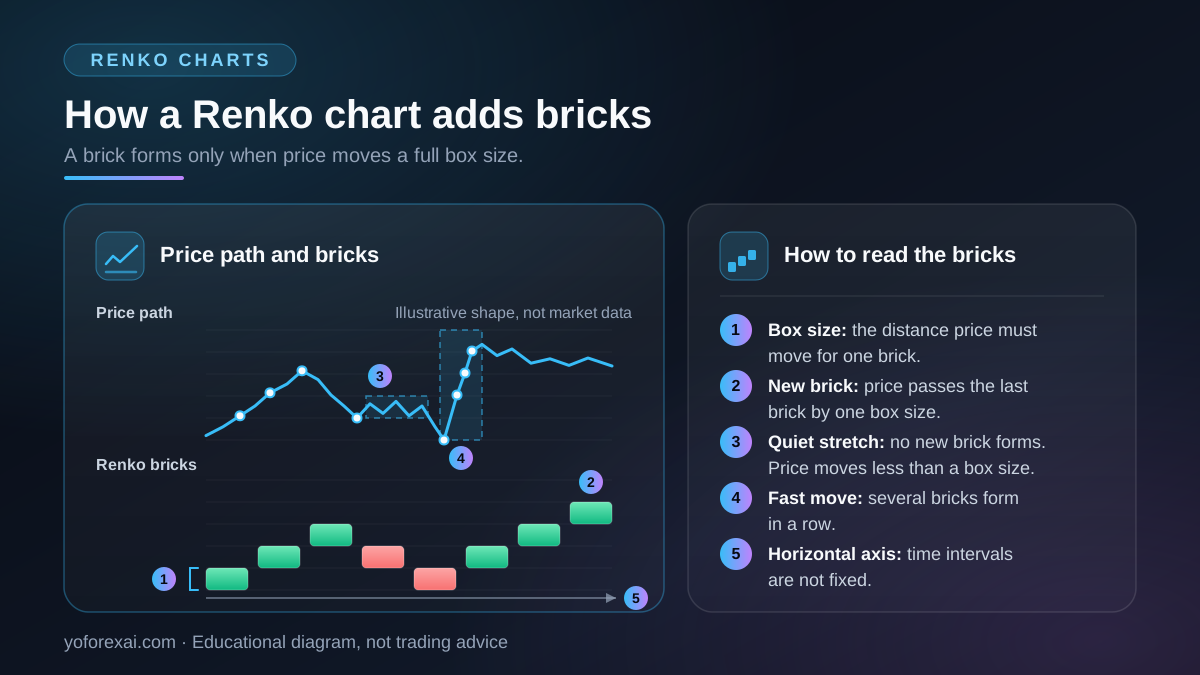
A Renko chart prints a new brick only when price moves by a set amount, called the box size, so it is not drawn on a fixed time scale. MetaQuotes' chart help lists bars, Japanese candlesticks and a broken line, and does not mention Renko.
Published · Updated · By YoForex AI Editorial Team
What is a Renko chart?
A Renko chart is built from price movement rather than from price and standard time intervals. The Renko chart article in cTrader's own help center describes it this way. The article says each new brick is created when price moves a specified amount, and that each block sits at a 45-degree angle, up or down, to the prior brick.
That makes a Renko chart a different view of the same price series, not a different market. The horizontal spacing of time is removed, so the chart does not show how long a move took. What it shows is how many steps of a fixed size price has covered, in each direction, and where it turned.
How are Renko bricks formed?
The main setting is the box size, which is the distance price must travel before a new brick forms. In cTrader's Renko section, the box size is entered in pips, from 1 to 100 pips. Other platforms may use a different unit or range, so read your own tool's settings before you compare two charts.
The cTrader article gives the rule with a 50-pip example: a brick is placed in the next column once price has surpassed the top or bottom of the previous brick by the box size amount. Its chart example uses a 10-pip box and says moves smaller than 10 pips are ignored.
That one rule covers both the top and the bottom of the previous brick. The cTrader article does not describe a separate reversal amount, so do not assume one. Other tools may add a reversal setting. If yours has one, write its value next to the box size. A chart without that value cannot be repeated by someone else.
The cTrader article says Renko charts use a fixed box amount. In cTrader you choose it in pips. This guide has no source for other box methods, so confirm the method in your own tool.
Why is time not fixed on a Renko chart?
A Renko chart can show a time axis, but the intervals on that axis are not fixed. The cTrader article makes this point directly. In this guide’s example, a brick forms only when price moves, so a quiet hour can add no brick at all, and a fast move can add several bricks at once.
This matters when you compare a Renko chart with a bar or candlestick chart. Ten bricks are not ten minutes of trading. Two charts with the same box size can show different brick counts over the same calendar day, because the count follows the path that price took, not the clock.
How does the box size change the chart?
The table shows what a smaller and a larger box size do to the chart, as the cTrader article describes it. It does not measure how any setting performs.
| Box size | Effect on the chart | The cTrader article, in brief |
|---|---|---|
| Smaller box | More bricks for the same price move. | Reducing the box size creates more swings and highlights potential price reversals earlier. |
| Larger box | Fewer bricks for the same price move. | A larger box size reduces the number of swings and the noise, but is slower to signal a price reversal. |
Keep the settings the same for every chart you compare. Write the box size, the method and any reversal value with each screenshot, next to the symbol and the capture time.
Can you use a Renko chart in MT5?
The MetaTrader 5 chart help says that price charts can be presented as a sequence of bars, Japanese candlesticks, or a broken line. It does not mention Renko, so Renko is not among the chart types that page lists.
The MQL5 documentation on custom symbols says users can build a custom symbol from the trade server's existing symbols, text files or external data sources, and that bars can be added to its history. The page does not mention Renko and does not describe how a Renko view would be built.
The MetaQuotes help lists no Renko chart type. Neither page says how to get a Renko view in MT5, so this guide names no tool. In this guide's reading, a chart type that is not in the MetaQuotes list needs a custom program, such as a custom indicator or a custom symbol. Before you install one, read its documentation or its code, confirm which price it uses, and set the box size and any reversal input in writing. Do not install a tool whose code or license you cannot check. Then work through these steps:
- Confirm the list. Open the terminal's chart types and check that Renko is not one of the built-in options.
- Choose the tool. Use the tool's documentation to find out whether it draws on the chart you already trade or needs its own price history.
- Write the settings first. Record the box size, the method and any reversal value before you look at the bricks.
- Check a short series by hand. Take a few bars you can read, apply the same settings, and confirm the brick count matches your own count.
- Test before you record. Run the setup on a demo account or on past history, and record results only after the test. The paper trading guide explains the limits of that test.
What can a Renko chart not tell you?
A Renko chart removes some information on purpose. The four limits below follow from the brick rule, and the cTrader article makes three of these points: time, wicks and the delay before a new brick.
- Time. Bricks carry no fixed time scale, so a count of bricks cannot tell you how long a move took.
- Wicks. The cTrader article says Renko charts ignore highs and lows and use only closing prices, so the high and low reached inside a brick do not appear on the chart.
- Gaps. The cTrader article does not mention gaps. On this guide's reading of the brick rule, a sudden move adds bricks in the next columns and leaves no empty space, so this guide treats a gap as hidden too.
- Lag. A brick forms only after price has moved by the box size, so the brick arrives after the move that caused it. The cTrader article warns that price could break significantly before a new box forms.
Changing the box size changes the picture. Two correct Renko charts of the same market can show different patterns if their box sizes differ. A Renko chart does not predict the next brick. Any rule built on it, such as an entry after a set number of bricks, is a hypothesis that needs a written definition and a forward test. The forex chart patterns guide makes the same point about shapes on any chart.
Risk warning. You can lose more than you deposit, depending on your broker and country. Trading with leverage magnifies losses as well as gains, and a position can move against you before a new brick forms. Check the rules that apply to you with your own regulator or local authority, and read the forex leverage and margin guide before you size any position.
What should a Renko screenshot show?
If you share a Renko chart for review, the image needs the details that a fixed time axis would otherwise give. Include the symbol, the box size and method, the colors used for up and down bricks, and the capture time. Without a fixed time axis, the box size and the price scale are what give a brick its meaning, so include both.
Crop out account details and order windows, as the AI forex chart analysis guide advises for any screenshot. The forex line, bar and candlestick guide explains why a candlestick chart with a visible scale is the input we suggest for AI review. A Renko chart is a different format, so that rule does not carry over directly. Write the settings with the image, so a reviewer can check what each brick represents.
Key takeaways
- A Renko chart prints a brick only after price moves by the box size, so time is not on a fixed scale.
- The box size and method define the chart. Record them with every screenshot and every test.
- The MetaTrader 5 chart help lists bars, Japanese candlesticks and a broken line. It does not list Renko.
- Brick counts follow the path of price, not the clock. Two charts with the same box size can differ over the same day.
- Renko hides time, wicks and gaps, and each brick lags the move that formed it.
- Test any Renko rule on a demo account or past history before you rely on it.
Frequently asked questions
Is Renko a built-in chart type in MetaTrader 5?
The MetaQuotes chart help lists bars, Japanese candlesticks and a broken line as the price chart types. Renko is not in that list. Check the chart types in your own terminal, because your version may differ from the help page.
What is the difference between a Renko chart and a candlestick chart?
A candlestick covers a fixed time period and shows that period's open, high, low and close. A Renko brick forms when price moves by the box size, and no fixed time period is attached to it. The two formats can show the same market very differently.
Does a Renko chart show wicks?
Not on the charts the cTrader article describes. It says Renko charts ignore highs and lows and use only closing prices. If you need that detail, use a time-based chart alongside the Renko view.
Can a Renko chart make a trend easier to see?
It can, because bricks only form after a set move, so small moves do not add bricks. Whether that helps any trading decision is a separate question. Answer it with a written rule and a forward test, not with the chart alone.
What box size should I use?
No box size is correct for every market. Choose one by a written rule, such as a fixed pip amount, record it, and test it on the same symbol before you change it.
Sources and verification
Primary-source links used for the platform behavior and risk statements in this guide. Sources reviewed 10 November 2026.
- Spotware (cTrader Help): Renko chart · Reviewed
- MetaQuotes: View and Configure Charts · Reviewed
- MetaQuotes: Custom symbols · Reviewed