YoForex AI educational guides
Keltner channel: EMA and ATR bands compared with Bollinger Bands
A Keltner channel is a volatility band drawn around a moving average, such as an EMA, with upper and lower bands set at a fixed multiple of the Average True Range (ATR) from the middle line. Bollinger Bands use a standard deviation instead of ATR. The two bands widen for different reasons, and neither band shows direction on its own.
Published · Updated · By YoForex AI Editorial Team
What is a Keltner channel?
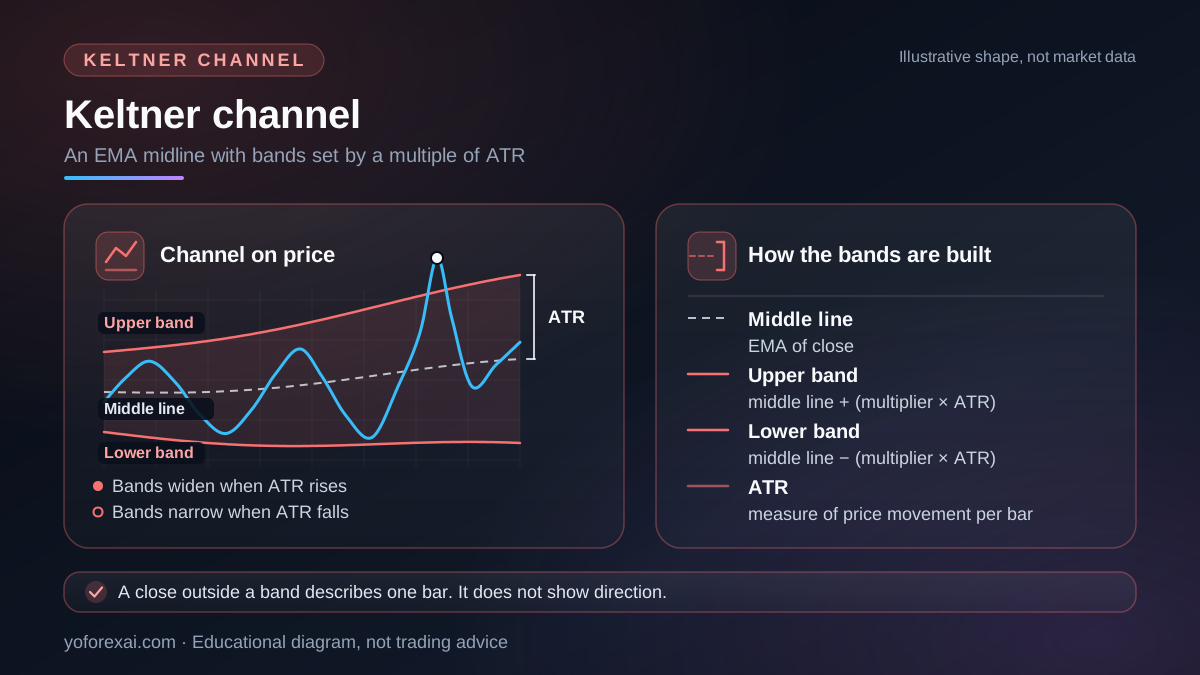
A Keltner channel is a set of three lines drawn on a price chart: a middle line, such as an exponential moving average (EMA), and an upper and a lower band. Each band sits a fixed distance from the middle line. That distance is a multiple of the Average True Range, a measure of how far price typically moves per bar. When volatility rises, the ATR rises and the bands widen. When it falls, the bands narrow.
The channel describes volatility around a recent average. It is not a signal. It shows where price sits relative to a smoothed centre and a smoothed range, and it does not say which way price will go next or how far it will travel. A close outside a band tells you where one bar closed. It does not tell you what the next bar will do.
How is a Keltner channel calculated?
The version described here uses an EMA midline with bands set by ATR. Implementations differ, so check the formula in whatever code or indicator you use. The table lists the inputs and what each one controls.
| Part | How it is set | What it controls |
|---|---|---|
| Middle line | EMA of the close, or another average, depending on the code | Where the centre of the channel sits. |
| ATR period | Set by the code | How quickly the band width reacts to changes in range. |
| Multiplier | Set by the code | How far each band sits from the middle line. |
| Timeframe | Chosen on the chart, such as H1 or D1 | The bar size that every input is measured on. |
MetaQuotes does not list a Keltner channel in its trend indicators, and scripts differ in the average, the ATR period and the multiplier they use. The formula below applies to the version described here:
Upper band = middle line + (multiplier × ATR). Lower band = middle line − (multiplier × ATR).
The EMA weights recent closes more than older ones. The EMA vs SMA guide explains that weighting and how it differs from a simple average. The ATR is defined in the MetaQuotes help page for Average True Range. It describes True Range as the greatest of three values: the current high minus the current low, the absolute gap between the previous close and the current high, and the absolute gap between the previous close and the current low. It states that ATR is a moving average of True Range values.
How does a Keltner channel differ from Bollinger Bands?
Bollinger Bands are the closest comparison. They also draw bands around a moving average, but they measure width with standard deviation rather than ATR. MetaQuotes says, “It is recommended to use 20-period Simple Moving Average as the middle line,” and advises to “plot top and bottom lines two standard deviations away from it.” The upper band is the middle line plus D times the standard deviation, and the lower band is the middle line minus the same amount, where D is the deviation multiplier. The source is the MetaQuotes Bollinger Bands help page.
| Feature | Keltner channel | Bollinger Bands |
|---|---|---|
| Middle line | EMA of the close, or another average, depending on the code | 20-period simple moving average, as MetaQuotes recommends |
| Width measure | ATR multiple, based on high, low and previous close | Standard deviation multiple, based on closes |
| Multiplier | Set by the code; no MT5 default | Two standard deviations, as MetaQuotes describes |
| Listed in MT5 trend indicators | Not listed | Listed |
Because ATR uses the high and low of each bar, a Keltner channel reacts to the full bar range. Standard deviation uses closing prices only. On a chart with long wicks, the two sets of bands can look different at the same moment, even with the same middle line.
Is a Keltner channel built into MT5?
Not as a named indicator in the MetaQuotes trend indicator list. That section of the MT5 help includes Bollinger Bands, Envelopes, Ichimoku Kinko Hyo and Parabolic SAR, among others, but not a Keltner channel. The closest built-in alternative is Envelopes, which place a fixed offset above and below a simple moving average rather than an ATR-based band.
The MT5 help does document Average True Range as a separate indicator. You can plot the ATR and calculate the bands yourself, or look for a custom indicator. A custom indicator is code written by someone else, so read it before you load it on a chart or into an Expert Advisor. This page does not recommend any custom indicator. Help pages change between builds, so check your own terminal’s Indicators menu too.
How do you read the bands?
Read a Keltner channel in four steps. Each step describes the chart; none of them is a forecast.
- Check the middle line first. Price above a rising midline describes a different context from price below a falling one.
- Note whether price closed outside a band, and on which bar. The close is a fact. What you conclude from it is an interpretation.
- Watch the band width. Narrow bands mean the ATR has fallen; wide bands mean it has risen. Width describes recent range, not the range to come.
- Decide before you test whether a close outside a band is a trigger, a filter, or only context. Changing that choice after a result changes the test.
A band edge is not the same as a support or resistance level. If you mark levels as zones, use the support and resistance guide as the reference for that work, and keep the two tools separate in your notes.
What does a worked example look like?
The numbers below are hypothetical and chosen to be round. They are not EURUSD data. The pair is quoted to four decimals, so 0.0020 is 20 pips.
| Line or input | Value | How it is calculated |
|---|---|---|
| Middle line (EMA of close) | 1.1000 | Given in this example |
| ATR | 0.0020 | Given in this example |
| Upper band | 1.1040 | 1.1000 + (2.0 × 0.0020) |
| Lower band | 1.0960 | 1.1000 − (2.0 × 0.0020) |
Suppose the next bar closes at 1.1045. That is above the upper band, so the chart shows a close outside the channel. The close does not show which way the following bar will move. Now suppose the ATR rises to 0.0030 on later bars while the middle line stays at 1.1000. The bands widen to 1.1060 and 1.0940. The same 1.1045 close now sits inside the channel. The chart is the same price; only the volatility measure changed.
What a Keltner channel cannot tell you
A Keltner channel has several limits that apply to every use, including a visual read, a rule in an Expert Advisor, and an AI chart review.
- Direction. A band touch or a close outside a band does not say which way price will move next.
- Lag. An EMA and an ATR both average past bars, so the channel reacts after a move has begun.
- Settings. The EMA length, the ATR period and the multiplier are choices. Changing them changes how often price closes outside the bands, so a result on one setting does not carry to another.
- Implementation. Two indicators called Keltner channel can use different formulas. Check the code, not the name.
- Volume. The calculation uses price only, so the tick-volume caveat that applies to OBV and VWAP does not apply to it. That does not make a Keltner channel a measure of market participation.
A band rule is a hypothesis until you test it. Write the rule first, run it on data you did not use to choose the settings, and record every signal, including the ones you did not take. The guide to evaluating a forex EA covers how to test an automated rule, and the Supertrend indicator guide shows another ATR-based band that is built differently.
An AI chart review can name a band and say where price sits against it. Treat that as a reading of the chart, not a result. Check every level against the chart and the timeframe. The AI forex chart analysis guide sets out that check.
Risk. You can lose more than you deposit, depending on your broker and country. Band-based rules are often tested on leveraged products, and a losing run can exceed what a single stop loss suggested. Check the rules that apply to you with your own regulator before you trade any setup.
Key takeaways
- A Keltner channel is a middle line, such as an EMA, with bands set at a multiple of the ATR above and below it.
- Bollinger Bands use standard deviation for width. A Keltner channel uses ATR, which reacts to each bar’s high-to-low range.
- The MetaQuotes MT5 trend indicator list includes Bollinger Bands and Envelopes but not a Keltner channel.
- A close outside a band describes one bar. It does not forecast direction.
- Settings and implementation change the result, so test one written rule on data you did not use to tune it.
Frequently asked questions
What is the difference between a Keltner channel and Bollinger Bands?
Both draw bands around a moving average. A Keltner channel sets its bands with a multiple of the ATR, which uses high, low and previous close. Bollinger Bands set theirs with a multiple of the standard deviation of closing prices. The width of each therefore responds to different measures of volatility.
Is a Keltner channel a buy or sell signal?
No. It is a volatility envelope. A close outside a band can be one input to a rule you write and test, but the channel itself does not say whether to buy, sell, or wait.
Does a Keltner channel have default settings?
No single default exists. The average, the ATR period and the multiplier are set by the indicator or code you use. MetaQuotes does not list a Keltner channel among its MT5 trend indicators, so this page cannot point to a built-in MT5 setting.
Does a Keltner channel need volume data?
No. The calculation uses price and the ATR, so it does not depend on volume. The MetaQuotes Volumes help page describes forex volume as “the number of price changes within each period of a selected timeframe”, and a Keltner channel does not use that figure.
Can I use a Keltner channel in an Expert Advisor?
Only if the EA’s code calculates the bands, or reads them from an indicator you have checked. An EA behaves according to its written rules. Test the EA on its own inputs and record the results before you rely on them.
Sources and verification
Primary-source links used for the platform behavior and risk statements in this guide. Sources reviewed 9 November 2026.
- MetaQuotes: Average True Range · Reviewed
- MetaQuotes: Bollinger Bands · Reviewed