YoForex AI educational guides
Ichimoku Kinko Hyo cloud: the five lines, example settings and limits
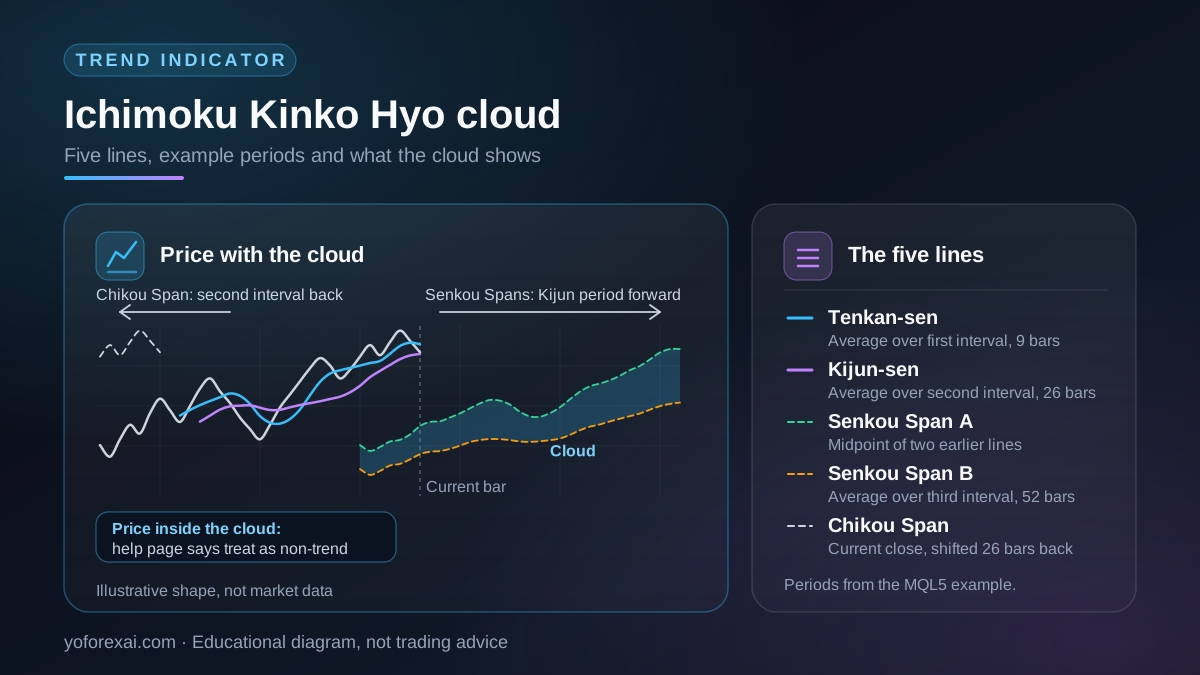
The Ichimoku Kinko Hyo cloud is a trend indicator built into MetaTrader 5. It draws five lines: Tenkan-sen, Kijun-sen, Senkou Span A, Senkou Span B and Chikou Span. The shaded area between the two Senkou spans is the cloud. It describes averages and their position against price. It does not forecast direction.
Published · Updated · By YoForex AI Editorial Team
What is the Ichimoku Kinko Hyo cloud?
The Ichimoku Kinko Hyo cloud is the shaded area on an Ichimoku chart. The full indicator is a set of five lines built from averages of past prices, and the cloud is the space between two of those lines. MetaQuotes lists Ichimoku Kinko Hyo among its trend indicators in the MetaTrader 5 help. Traders often shorten the name to the Ichimoku cloud. In this guide both names refer to the same indicator.
Ichimoku is a trend-reading tool. On one chart it shows where price sits against recent averages, whether the shorter average is above or below the longer one, and how the current close compares with price from 26 bars earlier, the Kijun-sen period used in the MQL5 example. Those readings describe the past and the present. They are not predictions of the next move.
What are the five Ichimoku lines?
The MetaQuotes help page for Ichimoku Kinko Hyo describes what each line shows, but it does not give numeric periods. The periods in the table are the values used in the example program in the MQL5 iIchimoku reference. Treat them as example values, not as properties of any market.
| Line | What it shows (MetaQuotes description) | Example period | Plotted shift |
|---|---|---|---|
| Tenkan-sen | Average price over the first time interval. | 9 bars | None |
| Kijun-sen | Average price over the second time interval. | 26 bars | None |
| Senkou Span A | The middle of the distance between two earlier lines. The help page does not name them. | No period of its own | Kijun-sen period forward (26 in example) |
| Senkou Span B | Average price over the third time interval. | 52 bars | Kijun-sen period forward (26 in example) |
| Chikou Span | The closing price of the current candle, shifted back by the second time interval. | No period of its own | Second interval, back (26 in example) |
The cloud is the area between Senkou Span A and Senkou Span B. MetaQuotes says the distance between the two Senkou lines is shaded in another color and called the cloud. Both Senkou lines are shifted forward by the Kijun-sen period, which is 26 bars in the MQL5 example. The part of the cloud at the right edge of the chart is calculated from prices that have already happened, but it sits over bars that have not yet printed.
Which settings do Ichimoku charts use?
The MQL5 example program sets 9, 26 and 52 as its input values for tenkan_sen, kijun_sen and senkou_span_b. The MQL5 reference for iIchimoku lists those three inputs but does not state default values, so the numbers are example values, not platform defaults. The same example uses the Kijun-sen period as the forward shift for the Senkou spans.
Changing a period changes every line that depends on it. A shorter Tenkan-sen reacts sooner to price, and the cloud can change shape. Test each change on the same chart history before you judge the result, and write down the settings with every observation.
Check the input settings when you open the indicator. A template or a screenshot from another trader may use different periods, and a screenshot without its settings is hard to compare with your own chart.
How do traders read price against the cloud?
The MetaQuotes help page describes three readings. The first is price position against the cloud. The page says that if price is between the two Senkou lines, the market should be considered non-trend. Its Kijun-sen section also says that if price is higher than Kijun-sen, prices will probably continue to increase. Those are the page's own descriptions. They are rules to test, not evidence that they work.
The second reading is the Tenkan-sen and Kijun-sen cross. The help page describes a buy signal when the Tenkan-sen crosses the Kijun-sen from below, and a sell signal when it crosses from above.
The third reading is the Chikou Span. The page says that when the Chikou Span crosses the price chart from the bottom up, that is a signal to buy, and from the top down, a signal to sell. Because the Chikou Span is the current close drawn back by the second interval, it compares today's close with past prices. The MetaQuotes description does not say when the value is final, so check this on your own platform.
Rules like these are easy to state and hard to judge. A cross on a one-hour chart is a different event from the same cross on a daily chart. Record the timeframe, the settings and the rule before you look at the result.
How do you test an Ichimoku rule?
Write the rule as one sentence before you open the chart. For example: “Enter long only when price is above the cloud and the Tenkan-sen crosses above the Kijun-sen. Exit when the cross reverses.” Then count every occurrence on the chart, including the ones you would not have traded. A few clear examples on a chart are not a test.
Hypothetical example. Suppose EURUSD closes at 1.1050 and the top of the cloud is at 1.1000. Under the rule above, price is above the cloud. You still have no signal until the Tenkan-sen also crosses above the Kijun-sen. Both conditions must hold on the same chart before the rule counts as triggered.
A demo or paper record can show whether you apply the rule the same way each time. It cannot show real fills or spreads. The paper trading guide explains those limits. If a rule gives too many signals, a second filter can help. The support and resistance guide explains how to mark levels as zones, which is easier to check than a single line.
What can the Ichimoku cloud not tell you?
The cloud has clear limits, and most of them come from the way the lines are built.
- It does not forecast. The lines are averages of past prices. The Senkou spans are drawn forward, but they are still calculated from data that already exists.
- It does not set a level that must hold. Price can enter the cloud, cross it and return. A cloud edge is a reference line, not a barrier.
- It is weak inside the cloud. The help page says price inside the cloud should be treated as non-trend, so a signal read there needs other evidence.
- The example periods are a convention. The 9, 26 and 52 settings come from an example program. Check them against your own symbol and timeframe before you rely on a rule built on them.
- The values depend on your chart data. Ichimoku is calculated from the price data your platform receives. A different broker feed or server time can give a different cloud on the same symbol in your platform.
- The signals on the help page are descriptions. A rule that looks clear on a finished chart can be hard to act on in real time.
For a wider view of how indicators sit next to pattern and level work, the forex chart patterns guide covers the same testing discipline for shapes on a chart.
Risk warning. You can lose more than you deposit, depending on your broker and country. Positions with leverage can move against you quickly, and a cloud signal does not limit that loss. Set your stop and position size before you enter, and read the leverage and margin guide before you trade. Check the rules that apply to you with your own regulator.
Key takeaways
- The Ichimoku Kinko Hyo cloud is a trend indicator with five lines. The cloud is the area between Senkou Span A and Senkou Span B.
- MetaQuotes describes what each line shows but gives no numeric periods. The 9, 26 and 52 example periods come from the MQL5 example program.
- The Senkou spans are shifted forward by the Kijun-sen period, and the Chikou Span is shifted back, so the chart mixes past data with future bars.
- The buy and sell signals and continuation readings on the help page are rules to test, not evidence that they work.
- Write the rule and the settings first, then count every occurrence on your chart before you judge it.
Frequently asked questions
Is the Ichimoku cloud good for forex trading?
No indicator is good on its own. The cloud can show whether a forex pair is trending or moving sideways, which is useful context. Whether a rule based on it works for you needs a fixed definition and a record of results on data you did not use to set the rule.
What do the 9, 26 and 52 numbers mean?
They are the values the MQL5 example program uses for Tenkan-sen, Kijun-sen and Senkou Span B. The Kijun-sen period also sets the forward shift of the Senkou spans in that example. They are example values, and you can change them in the indicator's inputs.
Does price above the cloud mean it will go up?
No. The MetaQuotes help page says that if price is higher than Kijun-sen, prices will probably continue to increase. That is a description of one reading, not a forecast. Price above the cloud can reverse, and the cloud is drawn from past prices.
How far back is the Chikou Span drawn?
The MetaQuotes description says the Chikou Span is the closing price of the current candle, shifted back by the second time interval. The MQL5 reference says the Chikou shift is already built into iIchimoku and gives no number for it. The shift lets you compare the current close with past price action on the same chart.
Can I use Ichimoku with AI chart analysis?
Yes, as a check. Ask the tool for its reasoning, then check each level it suggests against your own chart. The AI forex chart analysis guide sets out that check. YoForex AI is our product. It returns a suggested direction, entry, stop-loss and take-profit levels with its reasoning, for you to review.
Sources and verification
Primary-source links used for the platform behavior and risk statements in this guide. Sources reviewed 9 November 2026.
- MetaQuotes: Ichimoku Kinko Hyo · Reviewed
- MetaQuotes: iIchimoku · Reviewed