YoForex AI educational guides
Fibonacci levels in trading: retracement ratios, MT5 drawing and limits
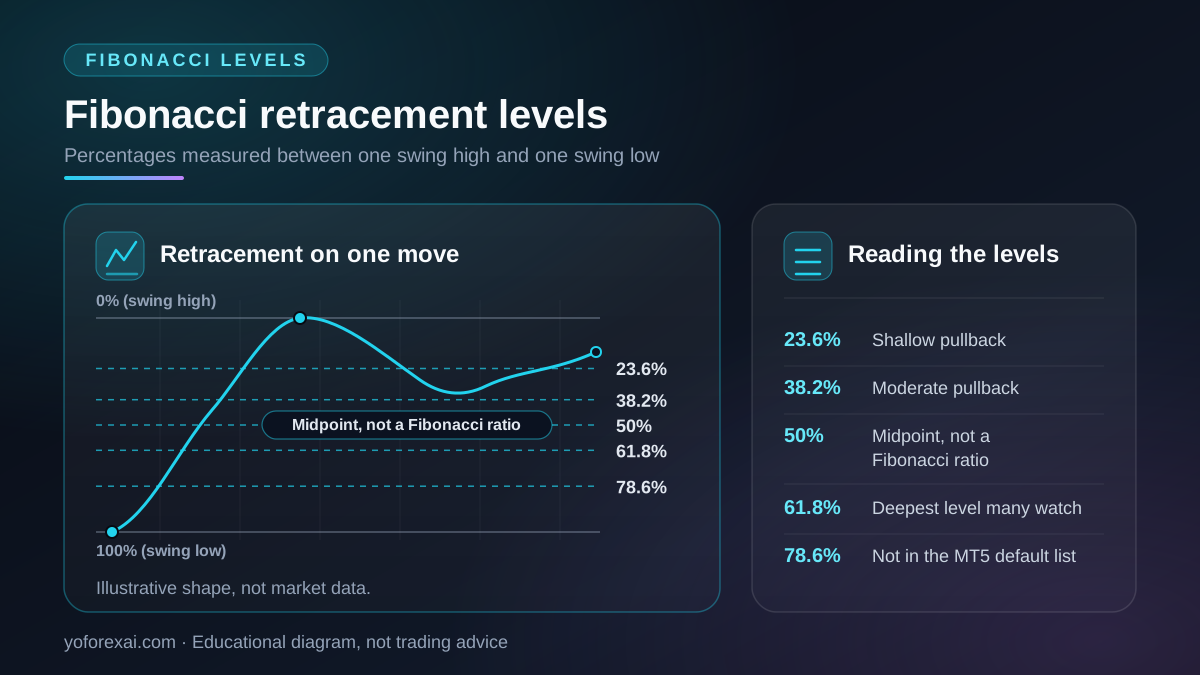
Fibonacci levels are horizontal price lines drawn at fixed percentages of the move between a swing high and a swing low, usually 23.6%, 38.2%, 50% and 61.8%. Traders use them as reference points for pullbacks. They are not forecasts, and 50% is not a Fibonacci ratio.
Published · Updated · By YoForex AI Editorial Team
What are Fibonacci levels and where do they come from?
Fibonacci levels are price levels found by measuring a retracement, the part of a move that price gives back. Take a rise from a swing low to a swing high. When price falls back from that high, the fall is the retracement. Fibonacci levels mark the prices at which that fall would reach set percentages of the original move. The percentages come from the Fibonacci sequence, in which each number is the sum of the two before it. Divide one number in the sequence by the next and the result approaches 0.618. Divide a number by the one two places ahead and you get values close to 0.382. Those ratios are a property of the sequence. They are not a property of the market, and nothing in the sequence says price will stop at any of them.
If you search for fibonacci patterns, you will find the same levels under that name. The tool is a ratio overlay on one move. It is not a chart shape that you confirm the way you confirm a pattern such as a double top or a flag. For how confirmation works on shapes, see the chart patterns guide.
Which Fibonacci levels do traders use?
The table lists the levels most often shown in the 0% to 100% range. The 0% and 100% lines are not retracement targets. They are the two swing points that the tool measures between.
| Level | Where it comes from | How it is read |
|---|---|---|
| 0% | The end point of the move, usually the swing high in a rise. | An anchor. Not a retracement target. |
| 23.6% | Close to 0.236, the ratio of a number to the one three places ahead. | A shallow pullback. Often the first reference after a strong move. |
| 38.2% | 0.382, the ratio of a number to the one two places ahead. | A moderate pullback. A common reference point in MT5 default sets. |
| 50% | Half of the move. Not a Fibonacci ratio. | A midpoint. Included in the MT5 default set, but not derived from the sequence. |
| 61.8% | 0.618, the ratio of consecutive numbers in the sequence. | The deepest level many traders watch for a pullback inside a trend. |
| 78.6% | About 0.786, the square root of 0.618. | Shown in many charting references. Not in the MT5 default list. |
| 100% | The start point of the move, usually the swing low in a rise. | An anchor. Not a retracement target. |
The 50% level is the one most often questioned. It is not produced by the sequence, which is why some guides call it a Fibonacci level and others call it a midpoint. The label does not change how you draw it, but it should change how you describe it in your own rules.
How do you draw Fibonacci levels on MetaTrader 5?
The MetaTrader 5 help describes the Fibonacci Retracement object as a trendline drawn between two extreme points. The platform then places horizontal lines where they cross that trendline at each level. Its default set is 0%, 23.6%, 38.2%, 50%, 61.8%, 100%, 161.8%, 261.8% and 423.6%, and it does not include 78.6%. The levels above 100% are extensions past the swing and are used differently, so this guide does not cover them.
- Choose the swing low and the swing high of the move you want to measure. Pick turning points you can point to on the chart, and be able to say why you chose them.
- Select the Fibonacci Retracement tool, click the first extreme point, then drag to the second.
- Check the labels. The tool shows where each level sits, so confirm that the 0% and 100% lines fall on the swing points you chose. The direction of the labels depends on where you started the drag, so check it on your own chart.
- Save the chart with the anchor points visible. If you move a swing point later, record that change in your notes.
The MetaQuotes help pages for the desktop terminal and the Android app describe the same default levels and the same two-point method.
How do traders use Fibonacci levels with support and resistance?
A common use is to watch whether price pulls back toward a Fibonacci level after a clear move, and then whether it shows a reaction there, such as a rejection candle or a failed push through the level. The levels tell you where to look. They do not tell you where price must stop. Many traders check whether a Fibonacci level lines up with an earlier swing high or low, because an overlap gives them a reason to look more closely. An overlap is still not a signal on its own. The support and resistance guide explains how to mark the zones that the levels would be compared against.
Trend context matters. A pullback inside a strong trend on a higher timeframe behaves differently from a retracement at the end of a long move. Check the larger picture before you draw the small one. If you use a pattern as well, the rules for confirmation and failure in the chart patterns guide apply the same way: write them down before you enter.
How far can a retracement go in a hypothetical example?
This example is hypothetical. The prices are round numbers made up for the arithmetic, not market data. Suppose a pair rises from a swing low at 1.1000 to a swing high at 1.1200. The move is 0.0200, which is 200 pips on a pair quoted to four decimal places. A retracement of each level is the percentage of that 0.0200 move, subtracted from the high.
| Level | Distance from the high | Price level |
|---|---|---|
| 23.6% | 0.00472 | 1.11528 |
| 38.2% | 0.00764 | 1.11236 |
| 50% | 0.01000 | 1.11000 |
| 61.8% | 0.01236 | 1.10764 |
| 78.6% | 0.01572 | 1.10428 |
In this hypothetical case, the 61.8% line sits at 1.10764. A trader who writes a rule about that line should also write what happens if price closes below it, and what would make the swing points invalid. The example shows the arithmetic only. It does not show that price would reach or respect any line.
What Fibonacci levels cannot tell you
Fibonacci levels have real limits, and most of them come from the way the tool is used rather than from the maths. If you also ask an AI tool to read a chart with these levels in view, check each line against the candles yourself, as the AI forex chart analysis guide recommends.
- They do not say which level price will respect. Any line can be crossed, and a level that held on one chart can fail on the next.
- They depend on the swing you choose. Two careful traders can pick different swing points on the same chart and get different levels.
- They do not show time. A level can be reached in one hour or after several weeks, and the levels themselves give no timing.
- They do not show volume at a level. A line on a chart does not tell you how much was traded there, and spot forex has no single central exchange volume.
- Redrawing after the fact proves nothing. If you move the anchors until the levels fit a past move, the drawing shows the fit, not a method.
The UK Financial Conduct Authority makes a related point in its guidance on understanding price graphs. It warns that the timeframe on a chart can be chosen to support a particular view, and that past performance is not a reliable guide to future results. Choose the timeframe before you draw the levels, and write it down with the result.
Risk warning. You can lose more than you deposit, depending on your broker and country. Fibonacci levels do not limit that risk. A stop placed beyond a line is a risk decision, not a guarantee, and positions held with leverage can lose value quickly when price moves past the line. The leverage and margin guide explains how a move against you affects a leveraged position. Check the rules that apply to you with your own regulator or local authority before you trade any setup.
Key takeaways
- Fibonacci levels are percentages of a swing move, usually 23.6%, 38.2%, 50% and 61.8%. They are reference lines, not forecasts.
- The 50% level is a midpoint, not a Fibonacci ratio. The 78.6% level is common in charting references but is not in the MT5 default set.
- On MT5, the tool is drawn between two extreme points. Check that the 0% and 100% anchors sit on the swings you chose.
- Pair the levels with support and resistance zones and with trend context, and write down what would make your reading wrong.
- The levels cannot say which line price will respect, when it will get there, or how much volume traded there.
Frequently asked questions
Which Fibonacci level is the most important?
None is proven to matter more than the others. MetaTrader 5 includes 23.6%, 38.2%, 50% and 61.8% in its default set, and a rule set usually picks only a few of them. Whichever you use, define it in your rules and test those rules on data you did not use to set them.
Is 50% a Fibonacci level?
It is a common reference, but it is not a Fibonacci ratio. It is half of the move. Some guides still call it a Fibonacci level because it is included in the default set of the tool, so the label is a convention rather than a mathematical result.
Does price always bounce at the 61.8% level?
No. Price can stop at a level, pass through it, or stay near it for a long time. A reaction at the level is something to check on the chart. It is not a guarantee, and a close beyond the level is a reason to reassess your reading.
How do I draw Fibonacci retracement levels in MT5?
Select the Fibonacci Retracement tool, click the first swing point, and drag to the second. Then check that the 0% and 100% anchors sit on the swings you chose. The steps are in the section on drawing levels above, with the MetaQuotes help page as the reference.
Are Fibonacci patterns the same as Fibonacci levels?
People who search for fibonacci patterns usually want the levels or the extension targets. The tool is a ratio overlay drawn on one move. It does not produce a shape that you confirm with a close, so judge it by the rules you set for it rather than by a visual pattern.
Can I use Fibonacci levels in an Expert Advisor?
Only if the EA documents the rules that use them, such as which swing points it measures and what it does at each level. Read the EA evaluation guide before you rely on any EA, and test its behavior in the Strategy Tester and on a demo account.
Sources and verification
Primary-source links used for the platform behavior and risk statements in this guide. Sources reviewed 9 November 2026.
- UK Financial Conduct Authority: Understanding price graphs · Reviewed
- MetaQuotes: Fibonacci Retracement (MetaTrader 5 for Android) · Reviewed
- MetaQuotes: Fibonacci Tools · Reviewed