YoForex AI educational guides
Currency strength meter: how it is calculated and what it cannot show
A currency strength meter is a tool that ranks major currencies, usually the eight majors, by how far each has moved against the others over a chosen period. It works from a basket of pairs and a lookback window, and each tool defines its method differently. A reading compares recent moves. It is not a signal or a forecast.
Published · Updated · By YoForex AI Editorial Team
A currency strength meter tries to answer one question on a single screen: which currency has been stronger recently, and which has been weaker. Most meters show the eight major currencies, US dollar, euro, British pound, Japanese yen, Swiss franc, Australian dollar, Canadian dollar and New Zealand dollar, as a ranked list or as lines on a chart. The ranking is only as useful as the method behind it.
What is a currency strength meter?
A currency strength meter is an indicator, or a small set of indicators, that compares currencies with each other rather than looking at one pair. A forex pair such as EUR/USD shows the euro against the dollar. Each pair therefore has two sides, and a rise in EUR/USD means the euro gained against the dollar, or the dollar lost ground against the euro, or both. A meter takes many pairs and sorts out those two-sided moves into one score per currency.
The idea is simple. A currency that rises against most of its partners is treated as strong, and one that falls against most of them is treated as weak. The reading is relative. It says nothing about what a currency is worth in any absolute sense, and it does not say why the move happened.
Meters are sold and shared as indicators for trading platforms. Each one defines its own inputs and its own arithmetic. Before you use one, read its description and its input settings, because two meters with the same name can rank the same market differently.
How is a currency strength meter calculated?
A common approach has four steps. Choose the pairs that contain each currency. Measure how far each pair has moved over a lookback window, such as the last four hours or the last twenty daily bars. Convert each move into the currency you are scoring, adding the move when the currency is the base and subtracting it when the currency is the quote. Then average the results for each currency. The average gives the score, and the ranking is the order of those scores.
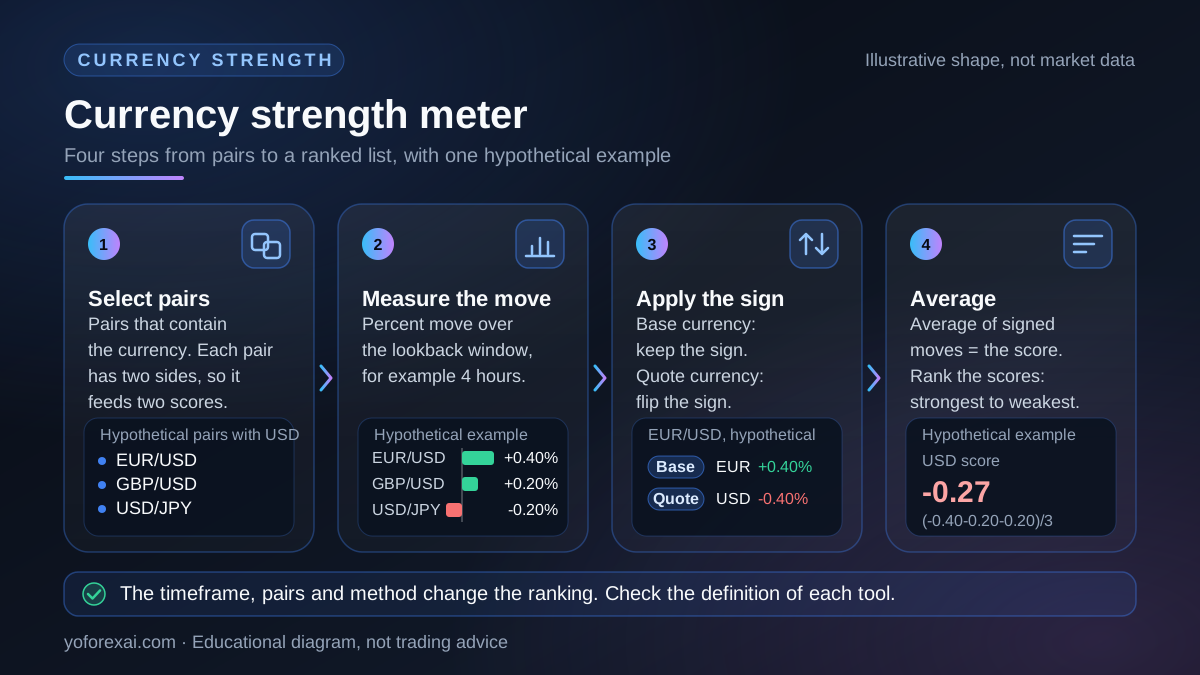
The sign rule is where most mistakes happen. In EUR/USD the euro is the base and the dollar is the quote. If EUR/USD rises by 0.40 percent, the euro gains and the dollar loses. Both sides of the same move must be recorded, or the scores will not sum to a sensible total.
Some meters weight every pair equally. Others weight pairs by volume, by correlation or by how recently they moved. Some use percentage change, and others use the change in a moving average or in a trend indicator. These methods are not a shared standard, so check how each tool was built before you compare one meter’s numbers with another’s.
Which pairs and timeframe should you use?
Two inputs shape almost every reading: the set of pairs and the timeframe that defines the lookback. Changing either one can reorder the list. The table below shows what each input controls and what to check before you accept a ranking.
| Input | What it controls | What to check |
|---|---|---|
| Pair set | Which pairs feed each currency score. Majors only, or majors plus crosses. | Every currency should have enough pairs for its score to mean something. Check that the broker symbols match. |
| Timeframe | The bar size used to measure the move, such as 15 minutes, 1 hour or daily. | A ranking on short bars can change within one session. State the timeframe with every reading. |
| Lookback | How many bars the move is measured over. | A short lookback reacts to a single news release. A long one can show a trend that ended hours ago. |
| Weighting and method | Whether pairs count equally, and whether the score uses price change or an indicator value. | Read the tool’s own description. The method is the part that differs most between tools. |
The timeframe needs the most care. MetaQuotes documents 21 chart timeframes in MetaTrader 5, from one minute to one month. Each one answers a different question. A one-hour meter asks which currency has moved most over recent hours. A daily meter asks which has moved most over recent days. Both can be correct and still disagree. A trader who changes the timeframe until the list matches a view has tested the view, not the market.
How do you read the ranking?
A ranking tells you the order of relative moves. It does not tell you the size of the gap in a way that carries across tools, and it does not say whether the leader will keep leading. The strongest currency on the list can be strong because it rose sharply in the last hour, or because it has been rising steadily for a week. The meter itself will not show which.
The example below uses a hypothetical set of round numbers to show the arithmetic. It is not market data and it does not come from any particular tool. It scores the US dollar over a four-hour lookback using three pairs with equal weight.
| Pair (hypothetical) | Move over 4 hours | USD position | USD contribution |
|---|---|---|---|
| EUR/USD | +0.40% | Quote | -0.40% |
| GBP/USD | +0.20% | Quote | -0.20% |
| USD/JPY | -0.20% | Base | -0.20% |
Hypothetical example, labelled numbers. The three contributions are -0.40, -0.20 and -0.20. Their average is -0.27 percent, so the US dollar scores -0.27 on this method, using these three pairs only. If a different meter used a daily lookback, or gave USD/JPY double weight, the score and possibly the rank would change.
Read the list as a comparison of recent moves. Two neighboring currencies may be close enough that a small change in the inputs swaps them. Look at the scores, and check whether the top and bottom groups hold across two or three timeframes.
How does an AI chart read fit with a strength meter?
A strength meter compares currencies. A chart read looks at one pair, one timeframe and the candles on the screen. They answer different questions, and combining them is a reasonable check if you know what each one is measuring. The AI forex chart analysis guide explains how to give a model a clear screenshot and how to check its output against the chart.
YoForex AI is our product. It is an AI-assisted chart-analysis dashboard: you provide a chart, and it returns a suggested direction, entry, stop-loss and take-profit levels with the model’s reasoning, for you to review. If you use a strength reading as one input, include the pair and the timeframe in your question, then compare the analysis with the meter’s own inputs.
Keep the roles separate. A meter shows how currencies compare. It cannot show whether one pair has a level, a trend or a catalyst that supports a trade. For the wider category, read the AI forex trading page.
What can a currency strength meter not tell you?
A meter is a summary of recent prices. It has several limits that apply to every version of it. The table below lists the common ones and what each one means for a reader.
| Limit | Why it matters | What to do |
|---|---|---|
| Lagging inputs | The score is built from past prices, so it reacts after a move starts. | Use it to describe the market, not to time an entry. |
| Method differences | Two meters with the same name can rank currencies in different orders. | Read each tool’s definition before you compare readings. |
| Forex volume counts price changes | The MetaQuotes Volumes help page describes forex volume as the number of price changes within each period. It is not a count of traded lots. | Do not read volume-based weights as a measure of traded size or of institutional activity. |
| Thin or news-driven moves | A release can move one currency sharply and flip the ranking for a short period. | Note the scheduled releases and check whether the ranking holds after the spike. |
The FCA’s guidance on price graphs makes a point that applies here. In its guidance on understanding price graphs, it says the timeframe or data shown may be selected to support a particular viewpoint rather than provide the full picture, and that past performance is not a reliable indicator of future results. A strength meter is a chart of selected data, so the same caution applies to it.
A meter also cannot show spreads, swap, slippage, or whether a pair is open for trading at the moment you look. The MetaQuotes Market Watch help page describes quotes that include bid, ask and spread, and that is where those costs are visible for each symbol. A ranking does not replace that check.
How should you test a strength meter before you use it?
Write down the pairs, the timeframe, the lookback and the question you want the meter to answer. Record each day’s ranking and what the strongest and weakest pairs did in the hours that followed. Do not change the timeframe after a poor week. The paper trading guide explains how to keep a forward record without risking money. The forex market sentiment guide covers the related problem of reading positioning and news tone.
Risk warning. Forex trades can be made with leverage. Leveraged positions can lose money quickly and can lose more than the amount you deposited, depending on your broker, account type and country. A currency strength reading does not change that. Retail forex rules differ by country, so check the rules that apply to you with your own regulator before you trade any setup that uses this tool.
Key takeaways
- A currency strength meter ranks currencies by their recent moves against each other, using a basket of pairs and a lookback window.
- The method differs between tools. Read the inputs, the sign rule and the weighting before you compare two readings.
- The timeframe changes the answer. State the timeframe with every reading, and check two or three before you draw a conclusion.
- A reading lags the market and cannot show spreads, swap, news impact or whether a trade is supported by a level.
- A meter is an input to your own review. It is not a signal, and it does not tell you when to enter.
Frequently asked questions
What is a currency strength meter used for?
It compares recent moves across the major currencies on one screen. Traders use it to see which currencies have been rising or falling against most of their partners, and to choose pairs to examine further. It describes relative movement and does not forecast the next move.
Is a currency strength meter a trading signal?
No. A strength reading summarizes past prices across several pairs. It does not state an entry, a stop-loss or a target, and it does not show that a trade is likely to succeed. Any decision based on it still needs your own rules for entry, risk and exit.
Why do two currency strength meters show different rankings?
They can use different pairs, timeframes, lookback windows, weights and calculation methods. Even small differences in those inputs can reorder the currencies that sit close together on the list. Check each tool’s description and settings before you compare the two.
Can a currency strength meter predict price moves?
It cannot. The score is built from prices that have already formed, so it describes what happened over the lookback. A change in the ranking can reflect a single news release or a short burst of trading, and it does not indicate what comes next.
What timeframe should I use for a currency strength meter?
There is no single correct timeframe. A shorter one reacts quickly to news. A longer one changes more slowly. Pick the timeframe that matches your question, write it down, and check a second timeframe before you rely on the reading.
Sources and verification
Primary-source links used for the platform behavior and risk statements in this guide. Sources reviewed 9 November 2026.
- UK Financial Conduct Authority: Understanding price graphs · Reviewed
- MetaQuotes: View and Configure Charts · Reviewed
- MetaQuotes: Volumes · Reviewed
- MetaQuotes: Market Watch · Reviewed